Skip to content

Blog#

The Last Wide Rung

You can already see it, if you look. Hiring freezes that never quite thaw. Entry-level jobs that quietly stop being refilled. A new graduate with a sharp degree and three hundred unanswered applications, who can't work out why the ticket stopped working. She is standing at the end of a fifty-year deal, and she is not the only one.

For about fifty years, an ordinary person in this country could climb into the middle class on nothing but a trained mind. No capital. No inheritance. No land, no machine, no family name to trade on. Just study and work. You learned something difficult, someone paid you to do it, and that paycheck was your claim on the nation's wealth — the reason the economy had to deal you in at all.

It is the best deal the modern economy ever offered an ordinary person — a share of the country's wealth for nothing but what you could learn. And it is ending.

We have watched the machine come for people's work twice before, and both times it ended well. The first wave — the Industrial Revolution — drove the farmhand off the land, and the factory was waiting to catch him. The second — automation, and the great wave of globalization — emptied that factory, and the office was waiting to catch his children. A way of making a living ended, and each time a wider one opened beneath it. That is the pattern, and it is real.

We've been here before

Farm to factory. In 1900, roughly four in ten Americans worked the land.1 And a whole village made its living in orbit around them — the blacksmith at his forge, the miller, the wheelwright. It was a world built on muscle, the farmer's and the horse's, and nearly every trade in town existed to keep that muscle working.

Then the machine arrived. The tractor, the combine — one man on a seat doing the work that had taken a dozen backs and a team of horses. The field didn't need those dozen anymore. It needed just one.

If you'd stood at the edge of that field and asked, "Where do all these people go?" — nobody could have told you. There was no answer to give. And yet they went somewhere. They drifted toward the cities, toward the smokestacks, and within a generation they'd become something their grandfathers had no word for: riveters and welders and machinists. The work was steadier than the harvest, and often better paid than the field had ever been.

The wide floor of the field emptied, and a wide factory floor opened to catch it.

Factory to office. In 1950, roughly three in ten Americans made their living in a factory — the riveter, the welder, the machinist. And a whole town made its living in orbit around them — the diner, the union hall, the corner store. It was a world built on the line, on the steady wage and the lunch whistle, and nearly every business on Main Street existed to spend what that wage brought home.

Then the machine arrived. The robot arm, the shipping container — an arm that welded all night without a wage, and a steel box that could carry the whole job overseas. The line didn't need those hands anymore. The ones it kept, it paid less.

If you'd stood on that factory floor and asked, "Where do all these people go?" — nobody could have told you. There was no answer to give. And yet they went somewhere. They drifted from the line into the office, out of the noise and into the fluorescent hum, and within a generation they'd become something their fathers had no word for: clerks and bookkeepers and analysts. The work was cleaner than the line, and often better paid than it had ever been.

The wide factory floor emptied, and a wide office floor opened to catch it.

Today, more Americans make their living with a trained mind than ever before — the analyst, the coder, the paralegal, the copywriter. And a whole economy makes its living in orbit around them — the software vendor, the office tower, the downtown lunch counter. It's a world built on the credential and the salary, and nearly every business downstream of it lives on what those salaries spend.

Then the machine arrived. The model, the agent — a mind that never sleeps, that reads every document and drafts every memo for the price of the electricity it burns. The office doesn't need those hundred anymore. It needs a few.

Stand in that office today and ask, "Where do all these people go?" — and nobody can tell you. There is no answer to give. We say they'll go somewhere; they always have. They'll drift out of the cubicle and into —

The wide office floor is emptying.

Into what?
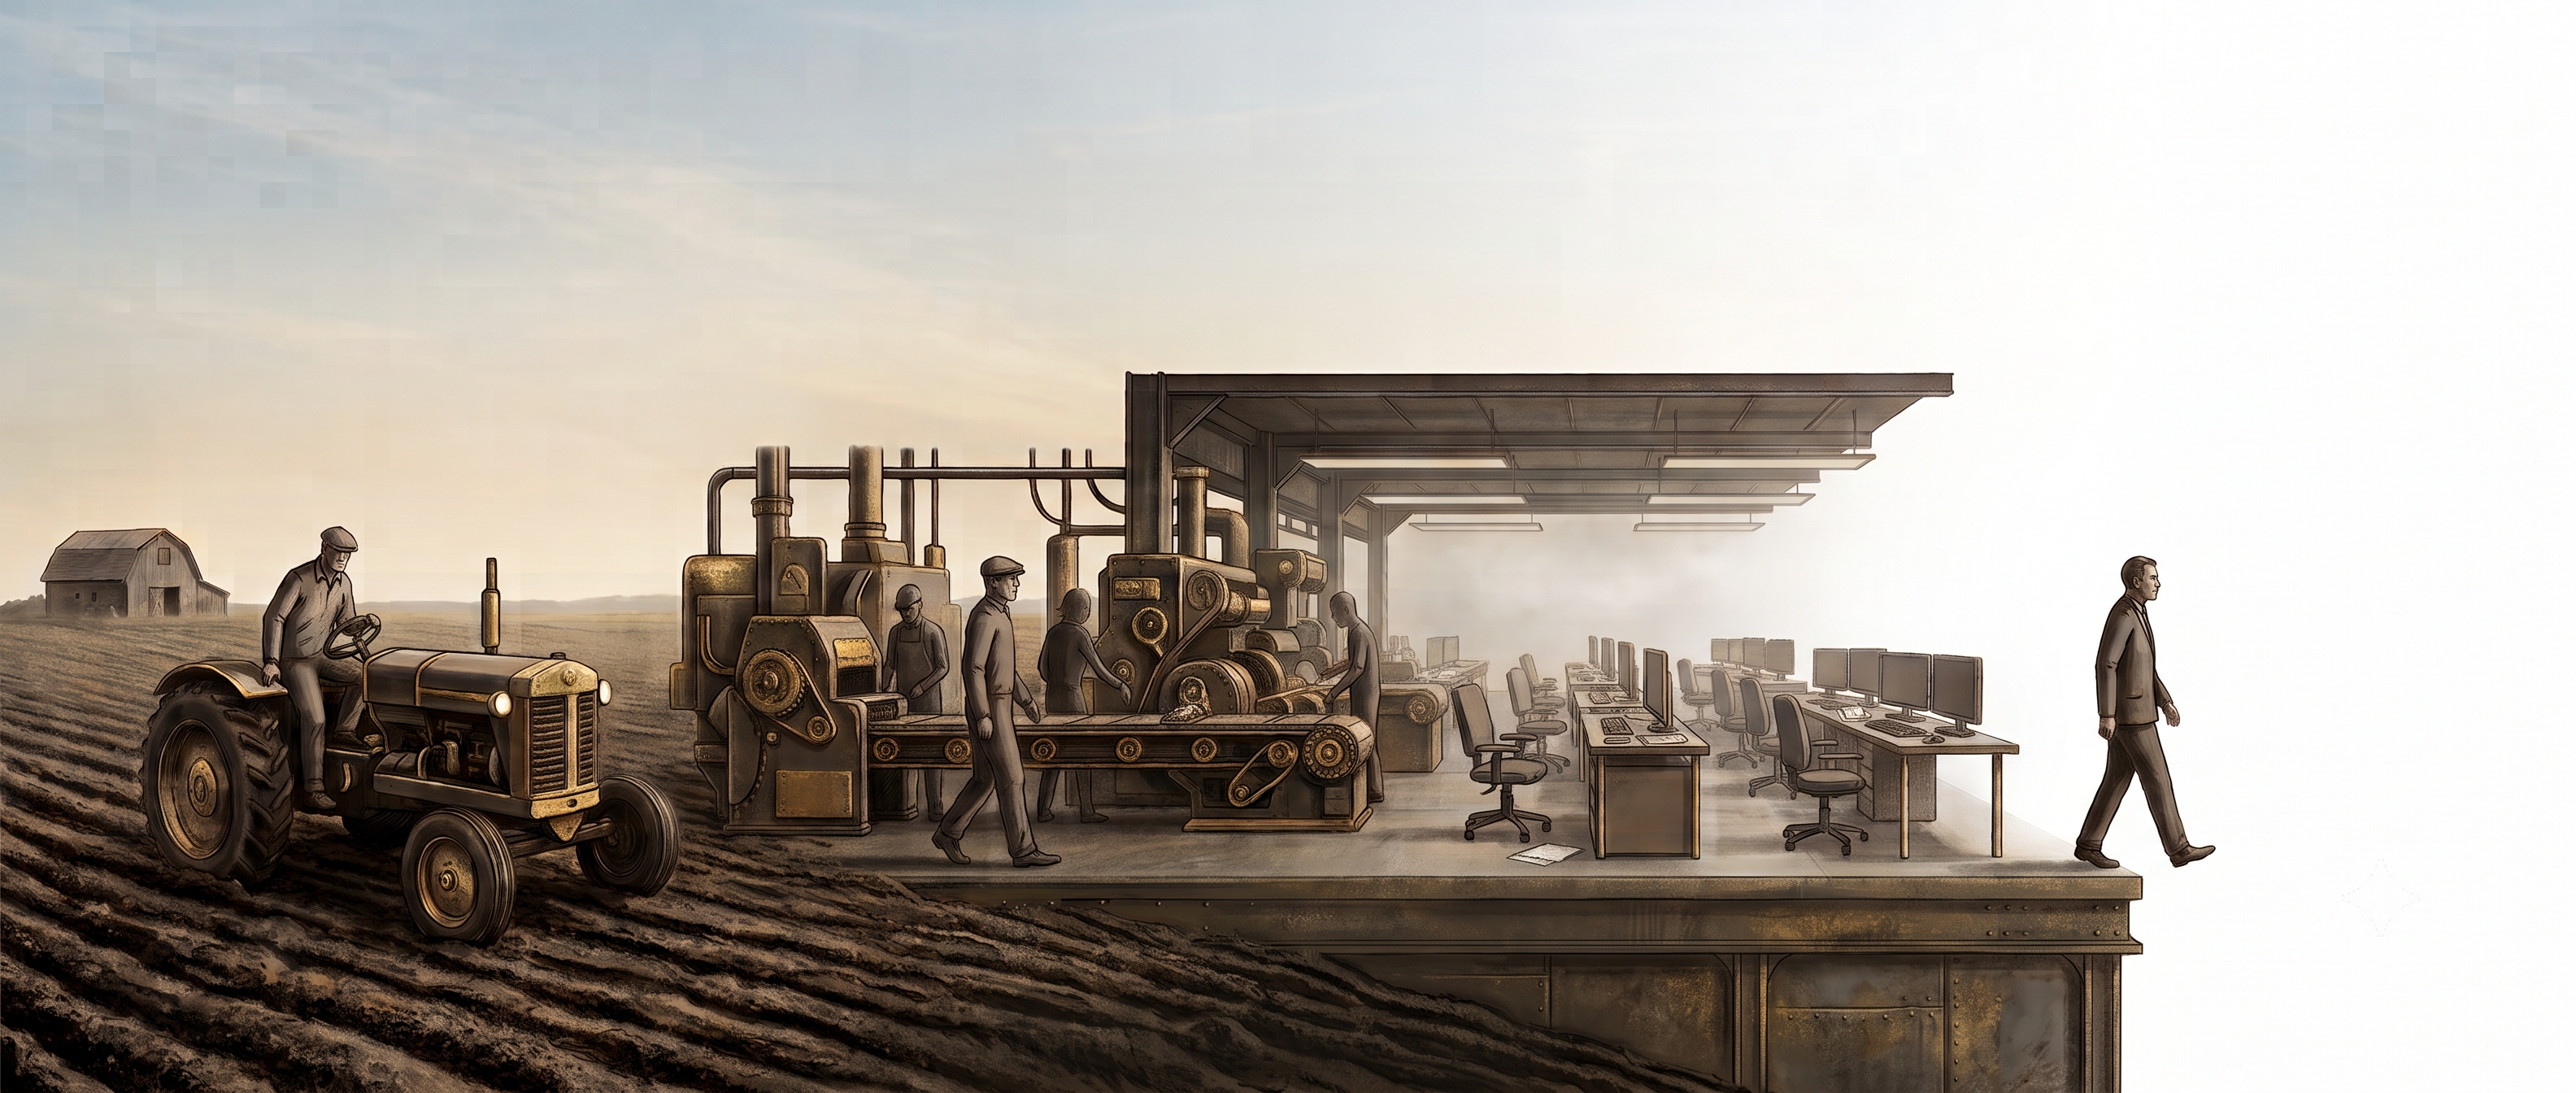
A lone office worker steps off the edge of a raised floor; behind him stretch the eras of work — a tractor in a field, a factory, rows of office desks — and ahead of him there is nothing but empty space

Follow the windfall

There are only two reflexive answers to Into what?

The pessimist says nowhere. This is the end of work — the machines have finally won. It's an old fear, and it has an old name: the lump-of-labor fallacy,2 the belief that there's a fixed pile of work in the world, so that every job a machine takes is one gone for good. Every generation reaches for some version of it; the Luddites smashed the looms over it. And so far, it has been wrong every time — because the pile was never fixed.

The optimist knows this, and says somewhere new. There has always been somewhere new, and he has two hundred years of being right. The work didn't run out when the loom came, or the tractor, or the assembly line — it grew, and the displaced always found a wider floor waiting below. So when he tells you the office will empty into something we can't yet picture, don't wave him off. History is sitting in his lap.

The people always followed the windfall. That's the thing both of them skate past, and it's what every upheaval in this essay quietly teaches: find where the windfall pooled, and you've found where the next floor opened. So before we bet on the optimist's streak holding one more time, let's ask the question neither side ever does — where does the windfall go?

So follow it. When the tractor made food cheap, it created a windfall — the gap between what food used to cost and what it now cost. Where did that windfall go?

Not to the farmer — not for long. A little stuck to whoever mechanized first, but competition pried it loose fast. It went downstream, to everyone, in a form so ordinary we don't call it wealth: a smaller bill at the grocer. Economists have a lovely name for that one, too — consumer surplus.3 It's the money that stays in your pocket when something you need gets cheaper. Bread drops from a dime to a nickel, and you didn't earn a thing — but you have that nickel, every day, for the rest of your life. Multiply it across a nation and it's a fortune, hiding in plain sight as the absence of a cost.

That pile of nickels didn't sit still. The country spent it — on things that had scarcely existed while bread was dear: a Ford in the driveway, a radio in the parlor, a Sunday at the pictures. And every one of those new comforts had to be built, by someone. The grocery money the tractor freed up became the wage that built the cars and the radios and the movie houses — and the farmhand walked off the emptying field and into the very factory his cheaper bread had paid to build.

Then it happened again, a generation later. The assembly line and the shipping container did to goods what the tractor had done to food — they made them cheap. You watched the last act of it yourself: a factory in China, a container ship, a Walmart at the edge of town — and a refrigerator, a flat-screen television, a season's worth of clothes cost a fraction of what they once had. The difference dropped back into the family's pocket. The same nickel off the bread, now a few dollars off nearly everything on the shelf.

And that money didn't sit still either. With the necessities cheap and a little left to spare, families started buying things they couldn't hold: a doctor's check-up, a mortgage on a house, a degree with a name on it, a song they didn't have to sing themselves. Services — and a service has to be rendered, by someone. So the savings off the cheap goods became the salaries of the people who rendered them, and every year there were more of them: more doctors, more lawyers, more accountants, more programmers. The factory worker rarely made that leap himself — his children did. They took the degree the surplus had paid for and walked into the office it had built.

Five links, every time:
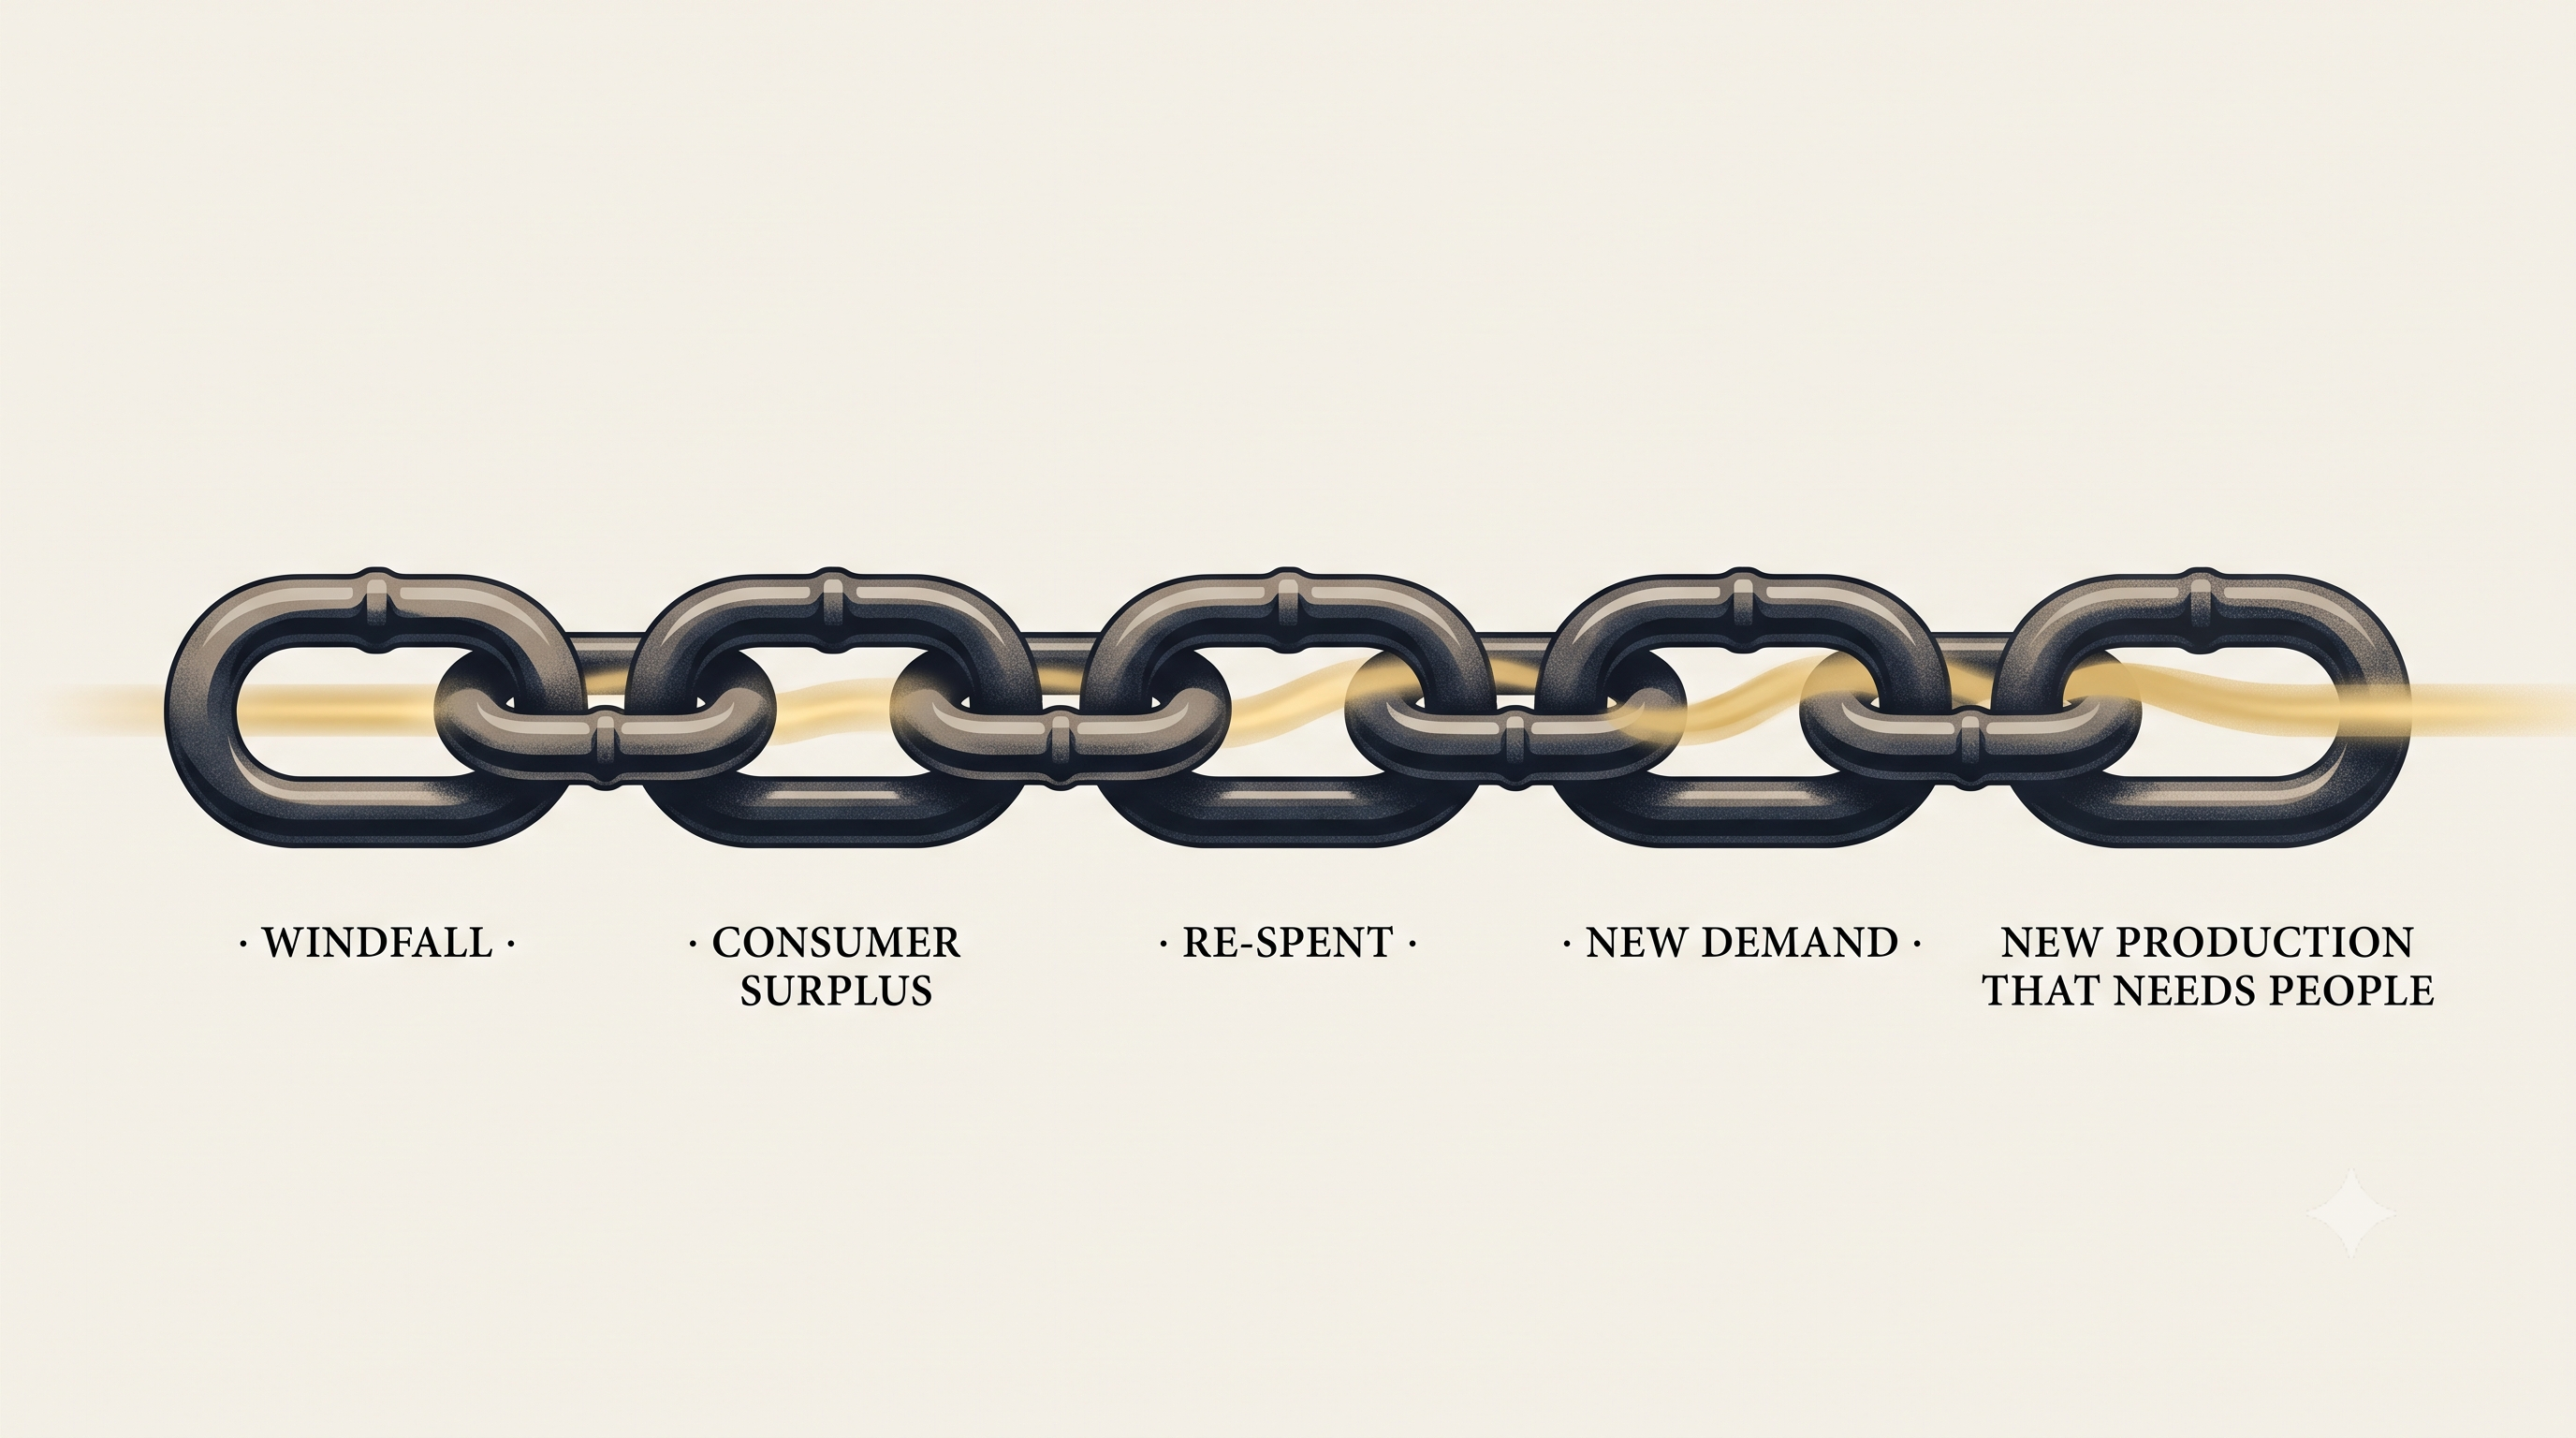
A five-link iron chain, every link whole and interlocked, with a golden stream of value flowing through all of them and off the end

windfall → consumer surplus → re-spent → new demand → new production that needs people.

So let's follow the value into our own predicament — link by link.

An AI reviews the contract, drafts the design, does the week's work in an afternoon. There's the windfall. It runs downstream, exactly as always, to whoever buys the result a little cheaper: consumer surplus, the same nickel off the bread, only now the bread is a legal contract, a tax return, a company logo.

And it will keep flowing, exactly as it always has. That money will get re-spent — it always is. The spending will call up new demand, new wants, new work to be done. Four links of the old chain, clicking into place right on schedule. And every instinct we have says the fifth is coming up behind them, the way it always has: the new demand becomes new jobs, and a floor opens under the falling.

But what if the new demand can be satisfied by the same machine that created the windfall?

Every time before, it couldn't. The tractor that emptied the field could not build the Ford. The robot arm couldn't analyze your mammogram. The factory in China couldn't write your contract.

What faces us now is different in kind: it is general. It does the contract, the design, the week's work in an afternoon — and it can turn and make whatever new thing the windfall dreams up next.

So the fifth link fails: new production no longer needs people. The one condition that saved us every time is the thing the machine quietly removes.

The sharpest optimists have one card left, and it has a name: the Jevons paradox.4 Make a thing cheaper, a Victorian economist noticed, and the world doesn't use less of it — it uses far more. Make code cheap and we won't write less software; we'll write oceans of it. They're right, and it's their best move. But watch where it lands. The demand for the work explodes — and the machine is what rushes in to meet it. More software than the world has ever seen, built by fewer people than ever. The paradox holds for the output and breaks for the worker.

Which is the whole of it, in a sentence:

The value still flows somewhere we can spend it. It no longer flows somewhere we can earn it.
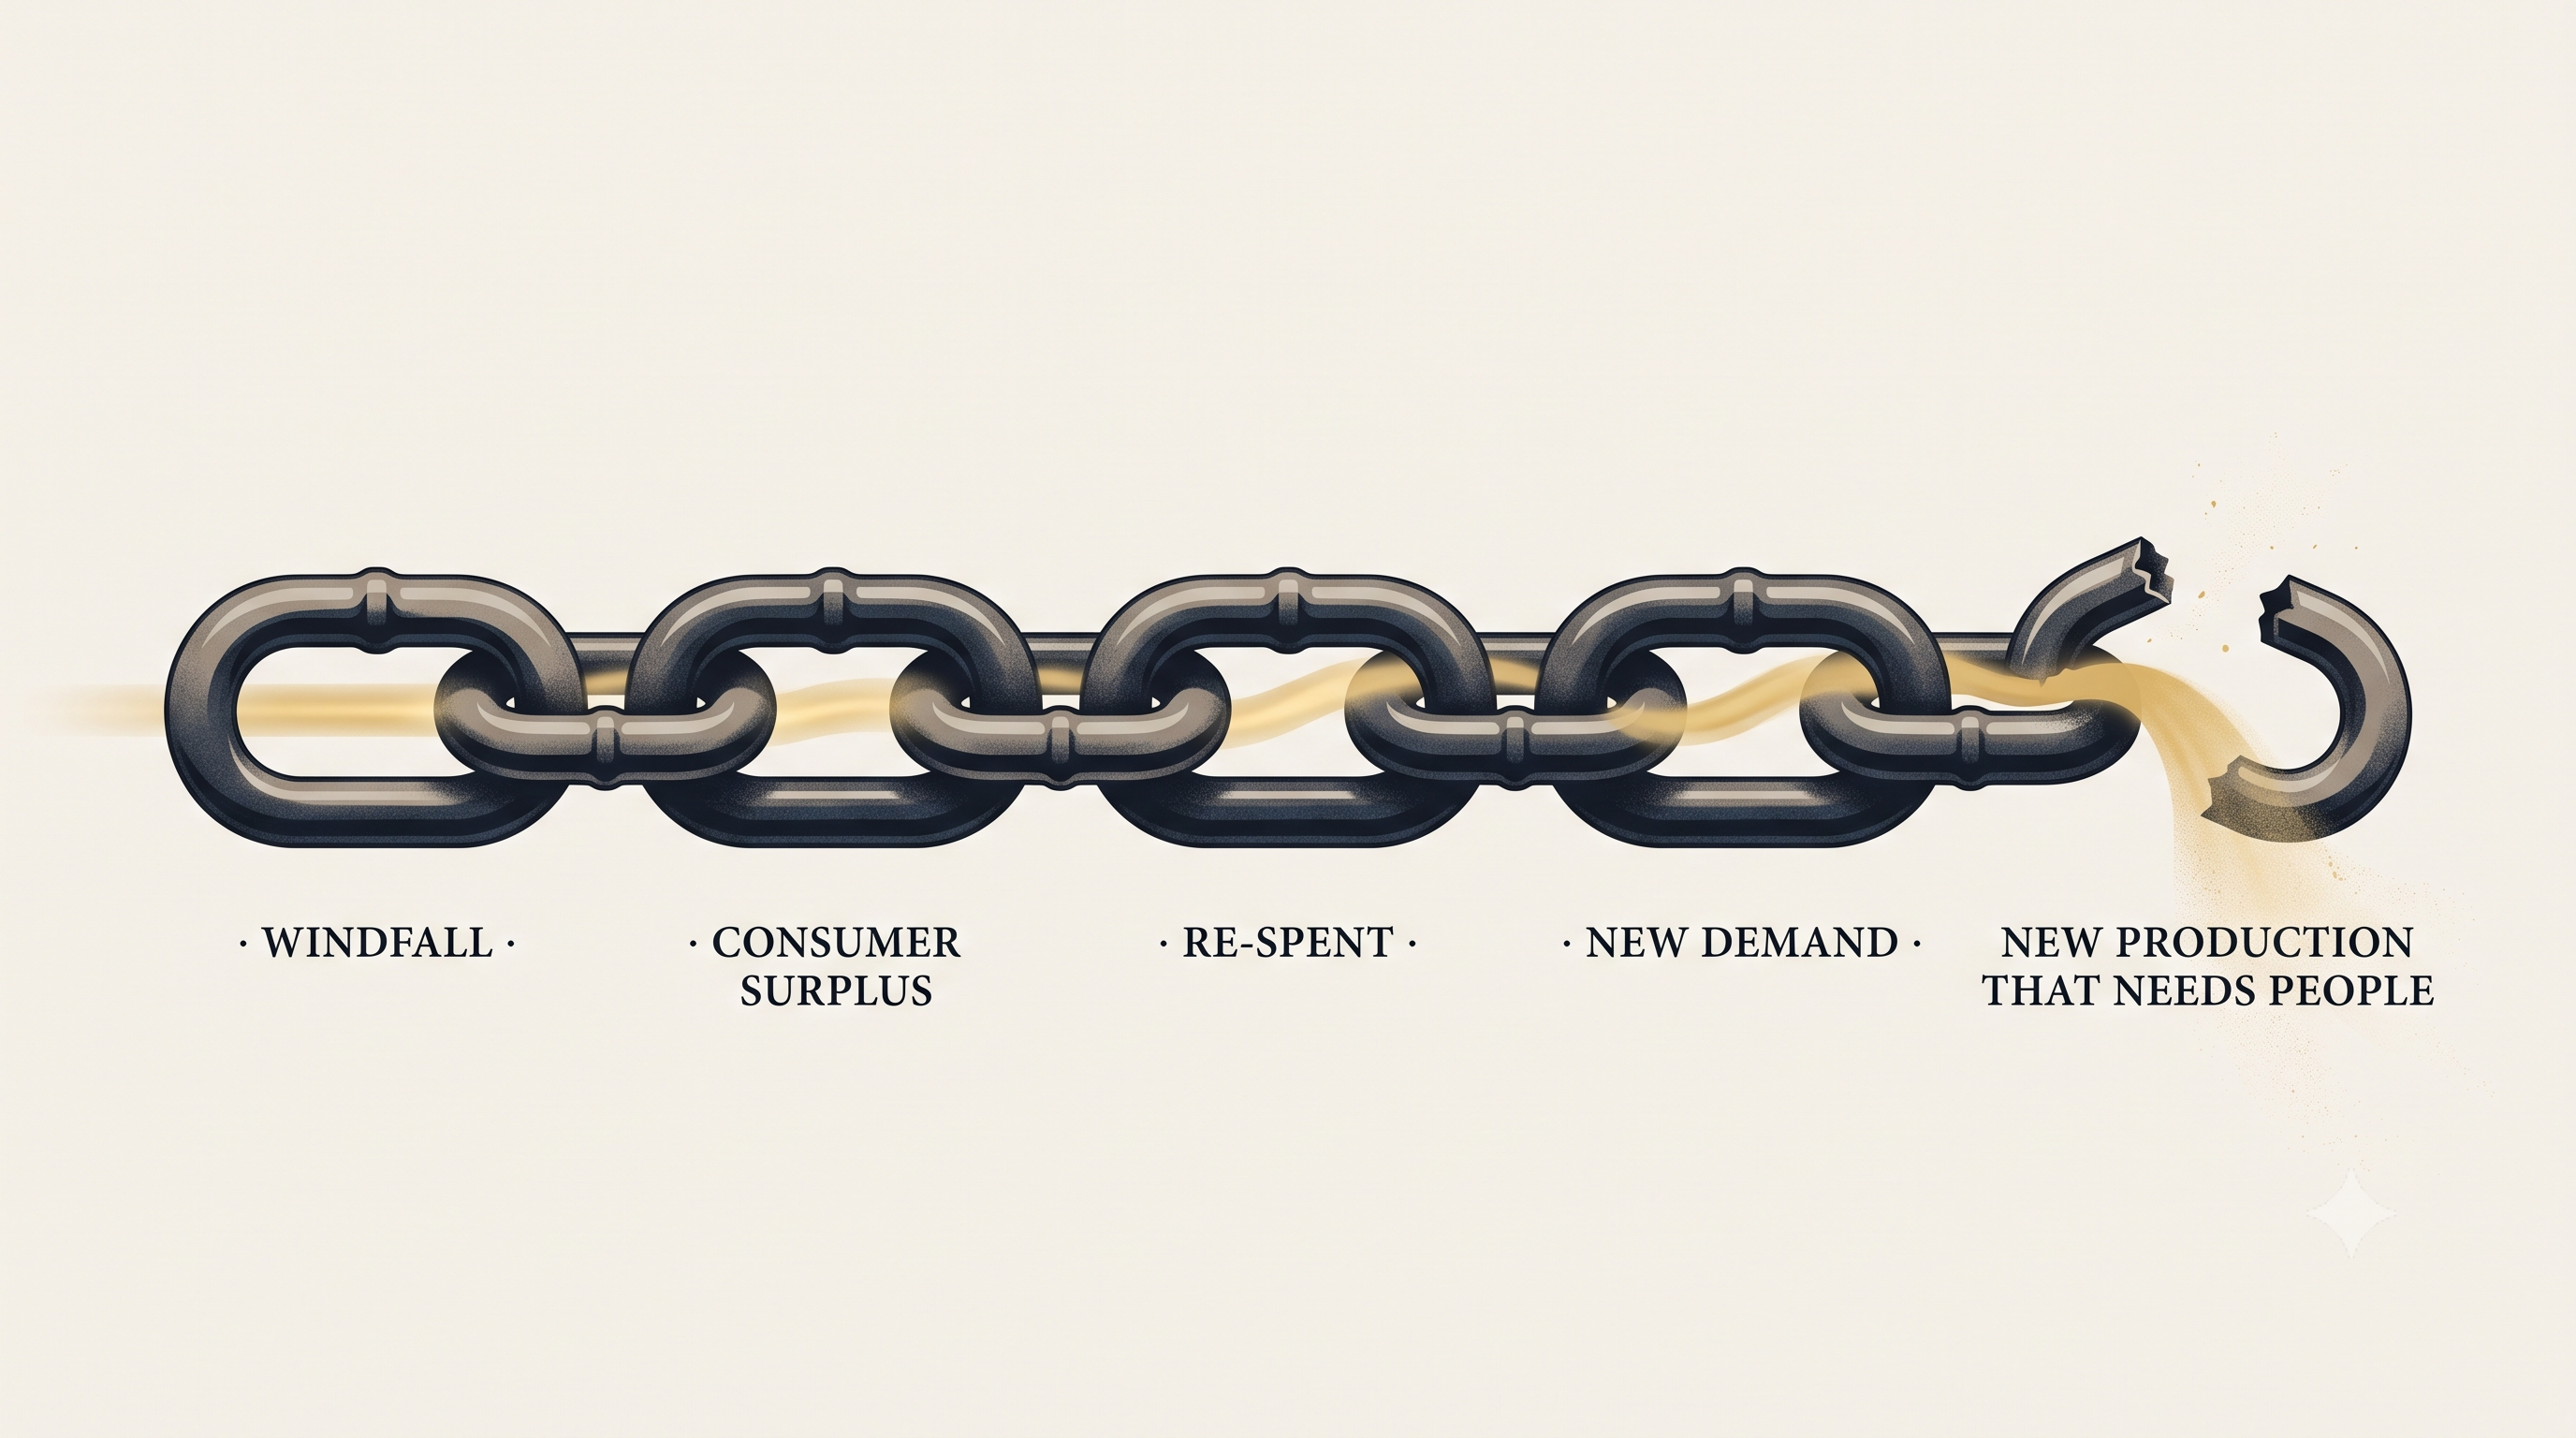
The same five-link chain, but the fifth link is snapped open and the golden value pours out at the break

Move up to what?

So change the question. Don't ask whether new work appears. Ask whether it can catch a mass of people — and whether it pays a living. Every rung that mattered in the last two centuries was both. The factory floor and the office floor weren't just jobs; they were wide, well-paid jobs that an ordinary person could reach by learning. That combination is the thing that made the ladder a ladder.

So name it. When people say the displaced will "move up," I keep asking the same thing: up to what? The answers are fewer than they sound. Two of them are jobs — and I'll take both seriously in a moment. A third isn't a job at all: stop being labor and become an owner. That one's the deepest answer of the three, which is exactly why it gets its own essay and not a line here — it's a wall you buy your way past, not a rung you climb, and we'll come back to it. For now, the two that are jobs, because they're the ones the optimist reaches for first.

The first: "They'll orchestrate the AI — supervise the agents, manage the fleet." Fine. Let's literalize it. A former analyst now directs a swarm of agents and does what a ten-person team used to do. But notice what that is: it is not a new floor with new seats. It's the same work, with nine fewer people. The entire value of the role is more output, fewer humans. So "moving up a rung" here means, precisely: nine people leave, and one stays with a better title. The promotion is the layoff. You cannot rehouse a displaced multitude on a rung whose whole purpose is to need fewer of them.

The second: "New categories we can't imagine yet — like podcaster, like app developer." Real, and I believe it. But ask the only question that matters for a ladder: how wide, and how well-paid? And hold that question, because to answer it honestly we have to talk about where a wage actually comes from. That turns out to be the crux of the whole thing — and it's the part almost nobody slows down to explain.

How a wage is actually made

Here's a question that sounds simple and isn't: why does anyone get paid what they get paid?

The tempting answer is "because the work is valuable." But that can't be the whole story, and there's a 250-year-old puzzle that proves it. Adam Smith named it in 1776 and couldn't crack it. It's called the diamond-water paradox.5 Water keeps you alive; without it you die in days. A diamond does nothing — it's a pretty rock. And yet water is nearly free and a diamond costs a fortune. If price followed value, water would be priceless and diamonds worthless. It's the other way around. Why?

The answer took economists another hundred years to work out, and it is this: price isn't set by how useful something is in total. It's set at the margin — by how much the next one is worth, and that depends on how scarce it is. Water is abundant, so the next glass is worth almost nothing, even though all the water in the world is worth everything. Diamonds are rare, so the next one is dear. Scarcity, not usefulness, sets the price.

Wages work the same way. Your pay tracks two things multiplied together: the value of what you produce, and the scarcity of your ability to produce it. You need both. A skill nobody wants pays nothing, however rare. And — here's the diamond-water half people miss — a skill everyone has pays nothing either, no matter how essential it is. A wage was never paid for value. It was paid for scarce value.

Now you can see why knowledge work paid so well for fifty years. A trained mind was valuable — it produced things people wanted — and it was scarce, because learning hard things is slow and not everyone does it. Productive and rare. A diamond. That's the rung, explained: it paid a broad, good wage because trained cognition was a diamond that ordinary people could, with effort, go and acquire.

What AI actually does to the wage

AI does not destroy the value of human cognition. Your judgment still produces plenty — arguably more than ever, amplified by the machine.

What AI does is change the scarcity. It takes the trained cognition that used to be rare and makes it abundant. It turns the diamond into water. Still essential — more essential, even — and now everywhere, on tap, for the price of a subscription.

And we already know what the market pays for something essential and abundant: it pays what it pays for water. Almost nothing. Not because the thing stopped having value, but because the next unit of it is no longer scarce.

A wage, as we just saw, is the price of scarcity — not of usefulness. So the wage falls even while the usefulness holds. You can keep the job and lose the living.

The scarcity that was always there

But the wage doesn't fall to zero. Strip away the cognition that just turned to water, and something is left standing underneath — something that was rare long before the machine arrived.

Call it craft — and I mean the word precisely: the thing you earn, through years of effort and rigor. The discipline to know which problem is worth solving, and when the machine has quietly gone wrong. The standard that won't ship what's almost right. The willingness to put your name on the outcome. None of it is new, and none of it just became scarce. It was always the rare thing. A great engineer and a mediocre one were never separated by the routine work the machine now does for both of them — they were separated by knowing which way is wrong, the call only one of them could make.

So the wage doesn't disappear. It splits. It collapses for the many, whose faculty just turned to water — and it holds, maybe climbs, for the few who developed their craft. The ladder doesn't narrow to a spike. The wide floor falls away, and what's left standing is the spike that was always there: a tall, thin place where a handful of masters command a scarce thing.

Years ago, on my first day after taking over as head of engineering for a team of about a hundred people, a new release was crashing in front of an important customer, and the team had a hotfix ready to ship. Everyone wanted it out the door — the customer was furious, the pressure enormous. I asked them to wait. Not because I'd read the code; I hadn't. Because I had made this exact mistake myself — fifteen years earlier, at another company, I was the dev manager, and I shipped the bad patch in the same kind of panic, certain it was fine, and watched it break. That's how I knew the shape of it: a patch written in a panic carries more bugs. So we kept testing. Two days later, there it was — a second bug, hiding in the fix. They wrote the tests that caught it, shipped a version that held, and we kept the customer.

A hundred capable people, and the moment that mattered turned on a call that took experience the rest of them simply hadn't had the years to earn yet. Their hands were abundant; the craft was scarce.

For the past year I've worked with Claude every day, and the division of labor is identical: left to itself, the machine will burn an afternoon sprinting confidently down the wrong road; left to myself, I can't move at anything near the pace we move together. It does the work of 30 engineers. I do the one thing it can't — I know when it's wrong. The model is abundant; the craft is scarce; the value lives in the craft.

And don't mistake that for good news about me. One of me is worth thirty only because the work stopped needing the other twenty-nine — my leverage and their absence are the same fact, seen from two seats. The machine complements the one by replacing the many.

Let me subject you to a thought experiment. Say there are thirty million software professionals in the world today; developers, QA engineers, support staff, and the rest of the trade.6 I suspect that in ten years there will be a tiny fraction of that — call it thirty thousand — and each one a master, each one supplying the scarce residue to a fleet of tireless machines. I might be wildly off on just how few are left. But the shape is the argument: a broad profession, paid a broad wage for a once-scarce skill, collapsing into a narrow spike of the few who hold what stays rare. The wide rung, falling away as you watch.

A master isn't born; he's made — on the lower rungs, doing the junior work clumsily until he's done it enough times to do it well. I learned to spot a doomed hotfix by shipping one myself, years before, back when I was the one in the panic. The spike is built entirely out of the floor beneath it.

But the floor is the first thing the machine takes. The entry-level work — the cheap, the routine, the learnable — is exactly what AI does first and best. The youngest workers in the most exposed fields are already quietly disappearing: not fired so much as never hired, their rung simply not refilled.7 So the masters left standing aren't the first of a new elite. They're the last of an old one — a generation with no apprentices behind it, because the apprenticeship is gone. Who trains the thirty-thousand-and-first?

"But everything will be so cheap"

Here's the objection I take most seriously, because it's the one I can't fully put down. Maybe the wage doesn't matter. If AI drives the cost of nearly everything toward zero — the doctor, the tutor, the lawyer, the ride, the kilowatt — then a small paycheck in 2040 might buy a fuller life than a six-figure salary buys today. Abundance, the optimists say, makes the wage beside the point. And they're partly right. I don't think this story ends in breadlines; nobody starves in a world this productive.

But a wage was never only what it buys. It was a claim — your share of the wealth you helped make — and a place, a reason the economy had to deal you in. And the things that actually make a life are not the things abundance makes cheap. The house in the district with the good school doesn't get cheaper when software does — there's only one of it, and now everyone's bidding. And what you own holds its value; what you rent does not. The cheap things get cheaper, and the scarce things — land, position, a claim on the future — get dearer, because that's where all the displaced money goes hunting for a home. You can hand every person a miracle and still leave them with no claim on it. That isn't a rebuttal to abundance. It's the question abundance can't answer — and I'll come back to it.

The rung and the wall

So that is the walk we just took. For fifty years an ordinary person could trade a trained mind for a claim on the nation's wealth, and climb. The machine has come for that trade the way it came for the farm and the factory before it — but this time no wider floor is opening beneath, because the thing that always opened it is gone. The value still flows. It simply no longer flows through us. What's left of the old rung is a spike: a narrow perch for the few who spent a lifetime earning a craft, and a long drop for everyone else. And the comfort we all reach for — it'll be so cheap — is the smallest comfort there is, because cheap is not the same as yours. A wage was a claim and a place — the reason the economy had to deal you in at all. Lose the wage, and it doesn't have to anymore.

Which leaves the question I promised to come back to — and it's the one everything else hangs from. If a trained mind is no longer a claim on the wealth, then what is? The only rung still standing above labor isn't a kind of work at all. It's ownership — not a rung you climb, but a wall you buy your way past. The windfall still falls from the tree. But the orchard has a fence now, and a name on the deed.

So the question was never really what will people do. It's what waits on the rung above — the one made of capital, not work, and the only place the value still pools. I've sat across the table from the investors already buying in. I've read what today's CEOs write to each other — addressed to companies, never to you. That's the rung we climb to next.
  1. About 41% of the U.S. labor force worked in agriculture in 1900 (USDA / U.S. Census historical series); manufacturing employment peaked at almost exactly three in ten — roughly 30% of all jobs — around 1950 (U.S. Bureau of Labor Statistics). 

  2. A long-standing term in economics for the assumption that there is a fixed quantity of work to go around. Some economists warn it gets invoked too readily to wave away genuine displacement — which is exactly why the argument here grants it in full and rests its weight elsewhere. 

  3. The gap between what a buyer would have been willing to pay and what they actually pay. The idea traces to the French engineer Jules Dupuit (1844); Alfred Marshall named and popularized it in his Principles of Economics (1890). 

  4. Named for William Stanley Jevons, who observed in The Coal Question (1865) that as steam engines grew more efficient and burned less coal per task, total coal consumption rose — cheaper steam power simply found far more uses. Economists now call it the rebound effect. 

  5. Smith laid out the puzzle in The Wealth of Nations (1776) as the gap between "value in use" and "value in exchange," but his labor theory of value couldn't close it. The resolution — marginal utility — arrived a century later, in the 1870s, discovered independently by William Stanley Jevons, Carl Menger, and Léon Walras: the Marginalist Revolution. 

  6. Conservative on purpose: estimates put software developers alone near 47 million worldwide, and the broader IT trade above 80 million. The argument only sharpens with a bigger base. 

  7. Stanford's Digital Economy Lab (Brynjolfsson, Chandar, and Chen, 2025) found early-career workers — ages 22 to 25 — in the most AI-exposed occupations already down about 13% relative to their peers, even after controlling for firm-level shocks. The mechanism wasn't layoffs; it was a quiet hiring freeze — firms simply stop backfilling entry-level roles as they empty. 

The Asymmetry

Two emails arrived on the same morning last week.

The first was four paragraphs long. It opened with background I already knew, wandered through a description of several problems without distinguishing which ones mattered, and ended mid-thought — no clear ask, no proposed next step. I read it twice and still wasn't sure what I was supposed to do. The sender had emptied their head into my inbox, and the work of organizing their thoughts was now mine.

The second was three sentences. It stated the problem, proposed a solution, and asked for my sign-off by Thursday. I read it once, replied in thirty seconds, and moved on.

Same medium — text in a rectangle on my screen. Completely different experience. One was like drawing in a breath and finding oxygen. The other was like drawing in a breath and finding nothing.

The Factoring Problem

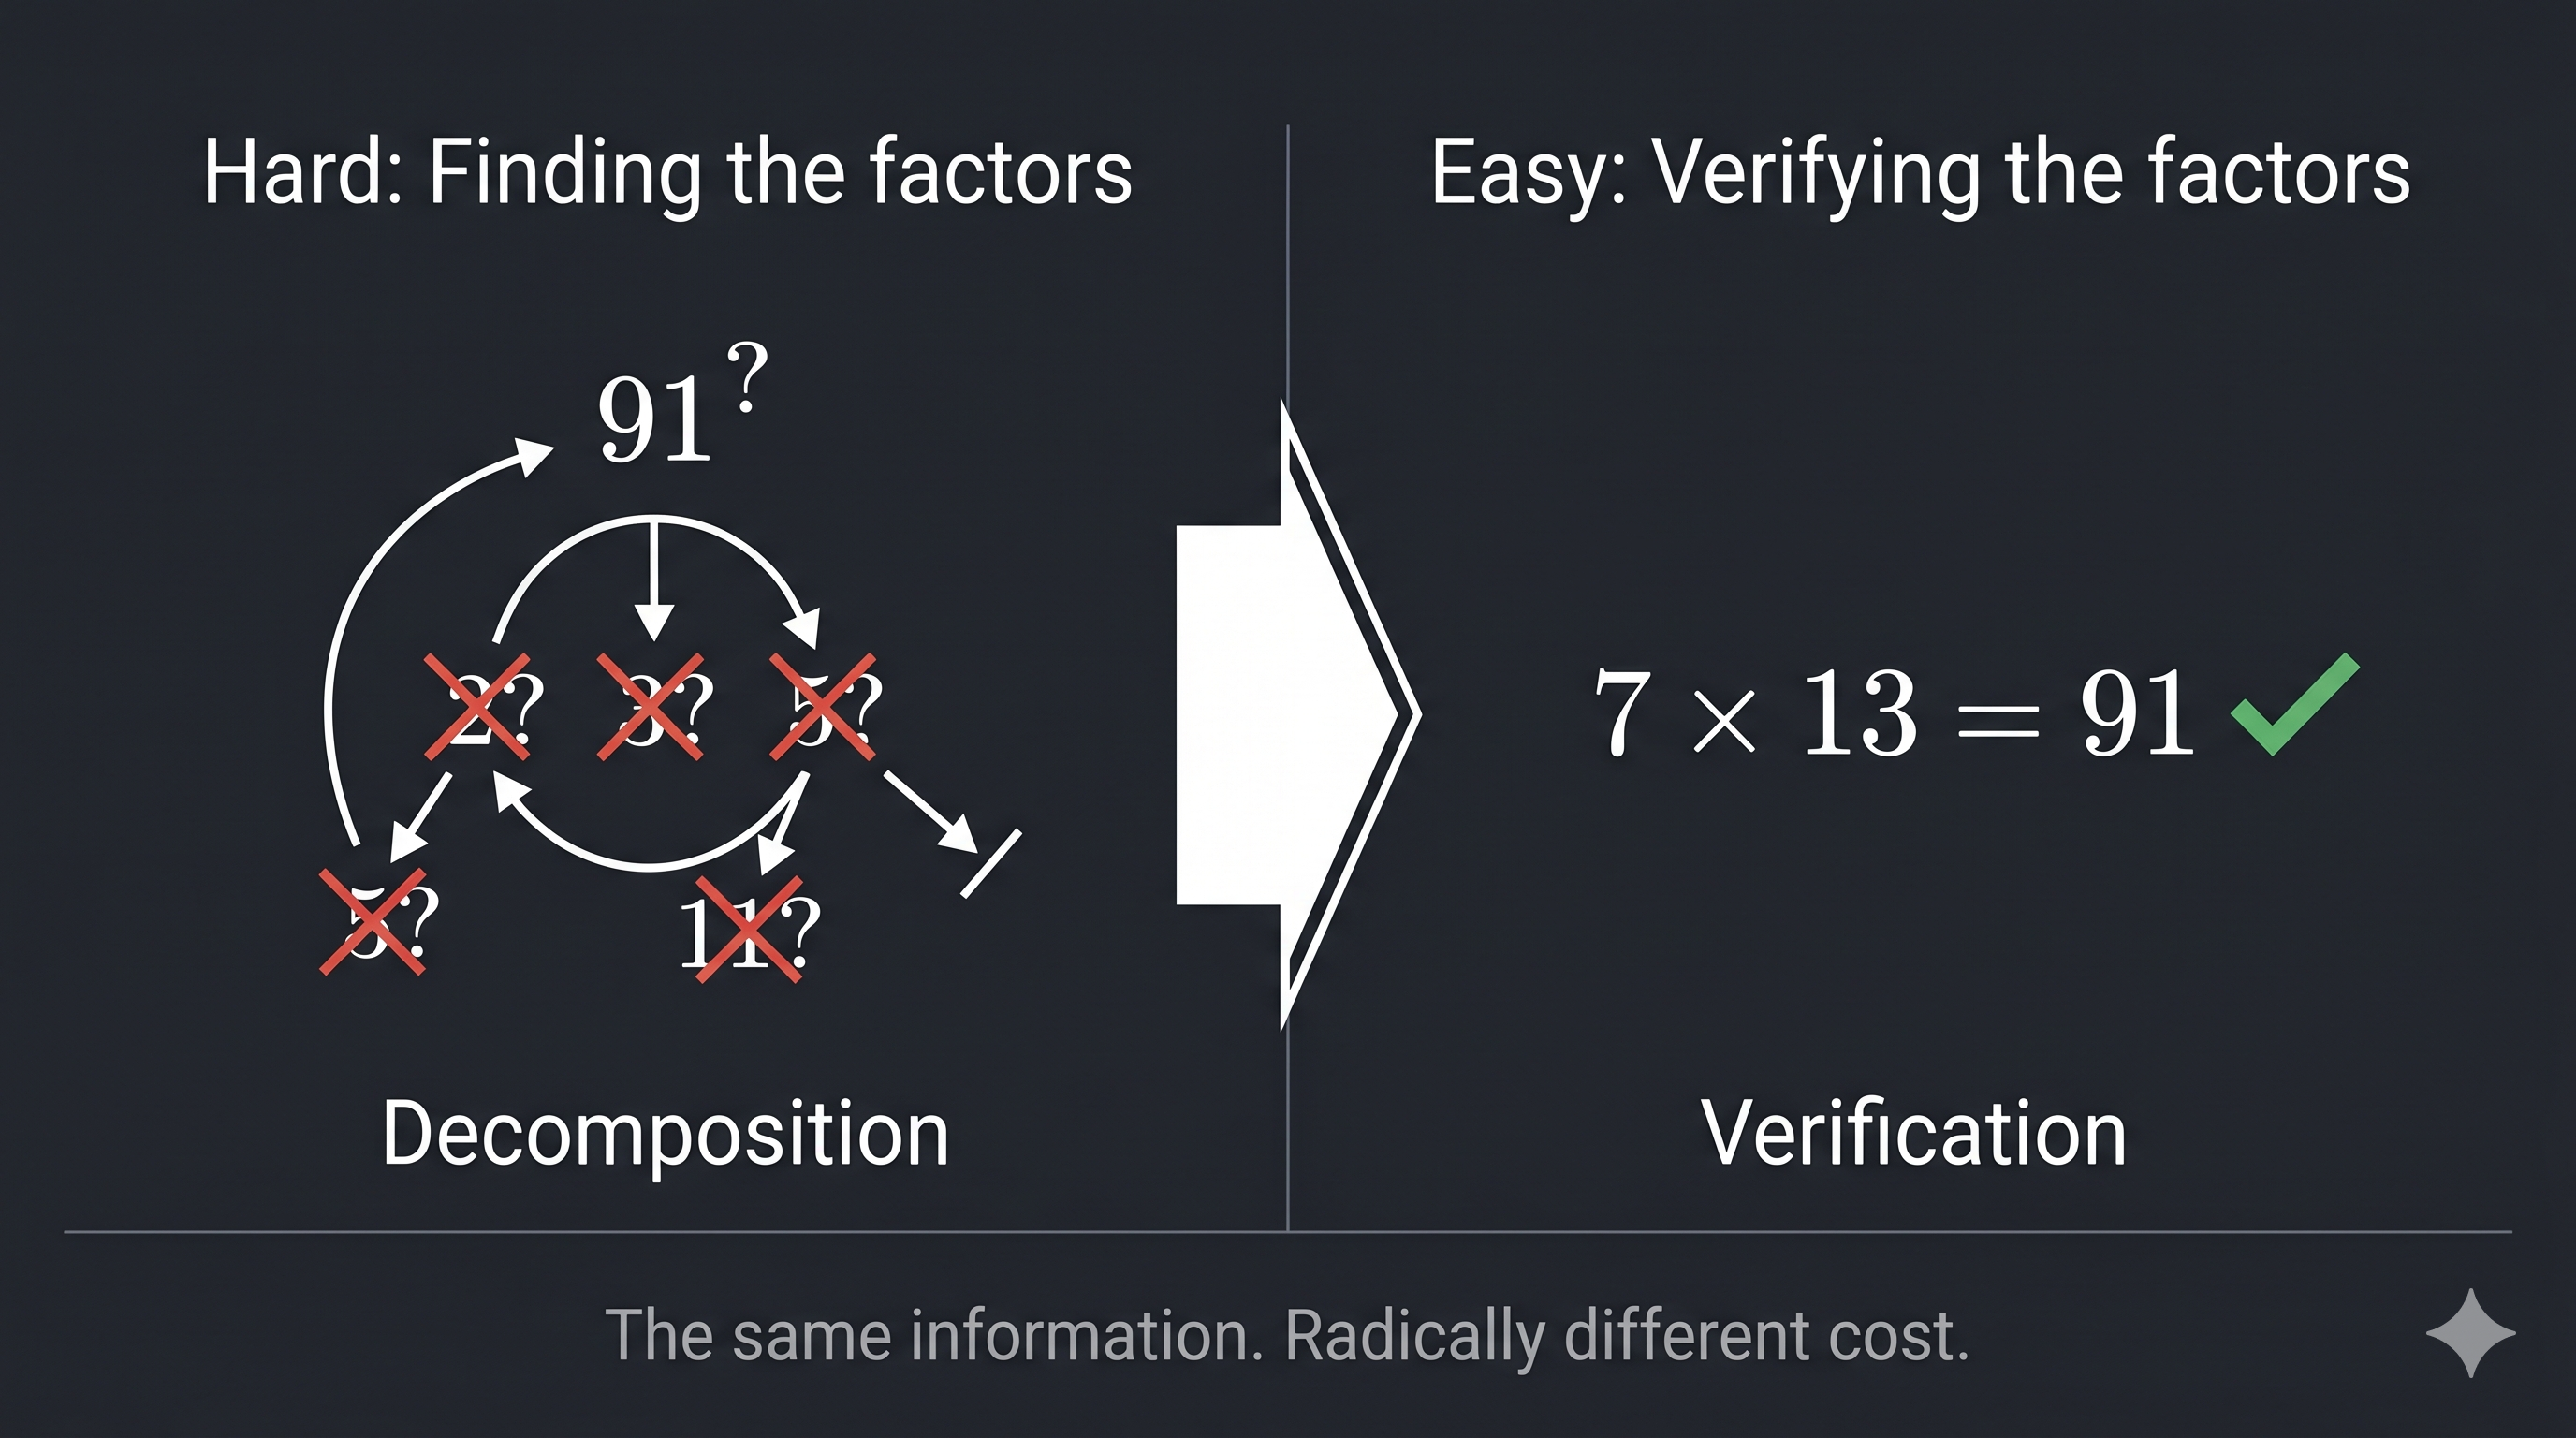
There's an operation in mathematics called prime factorization. Given a large number, find the primes that multiply together to produce it. It's famously hard — so hard that modern cryptography depends on it. But here's the thing: verifying the factors is trivial. If I tell you that 7 × 13 = 91, you can confirm it in your head. Finding those factors in the first place is where the work lives.

The factoring asymmetry — finding the prime factors of 91 is hard; verifying that 7 × 13 = 91 is trivial

You Can Still Understand the Machine

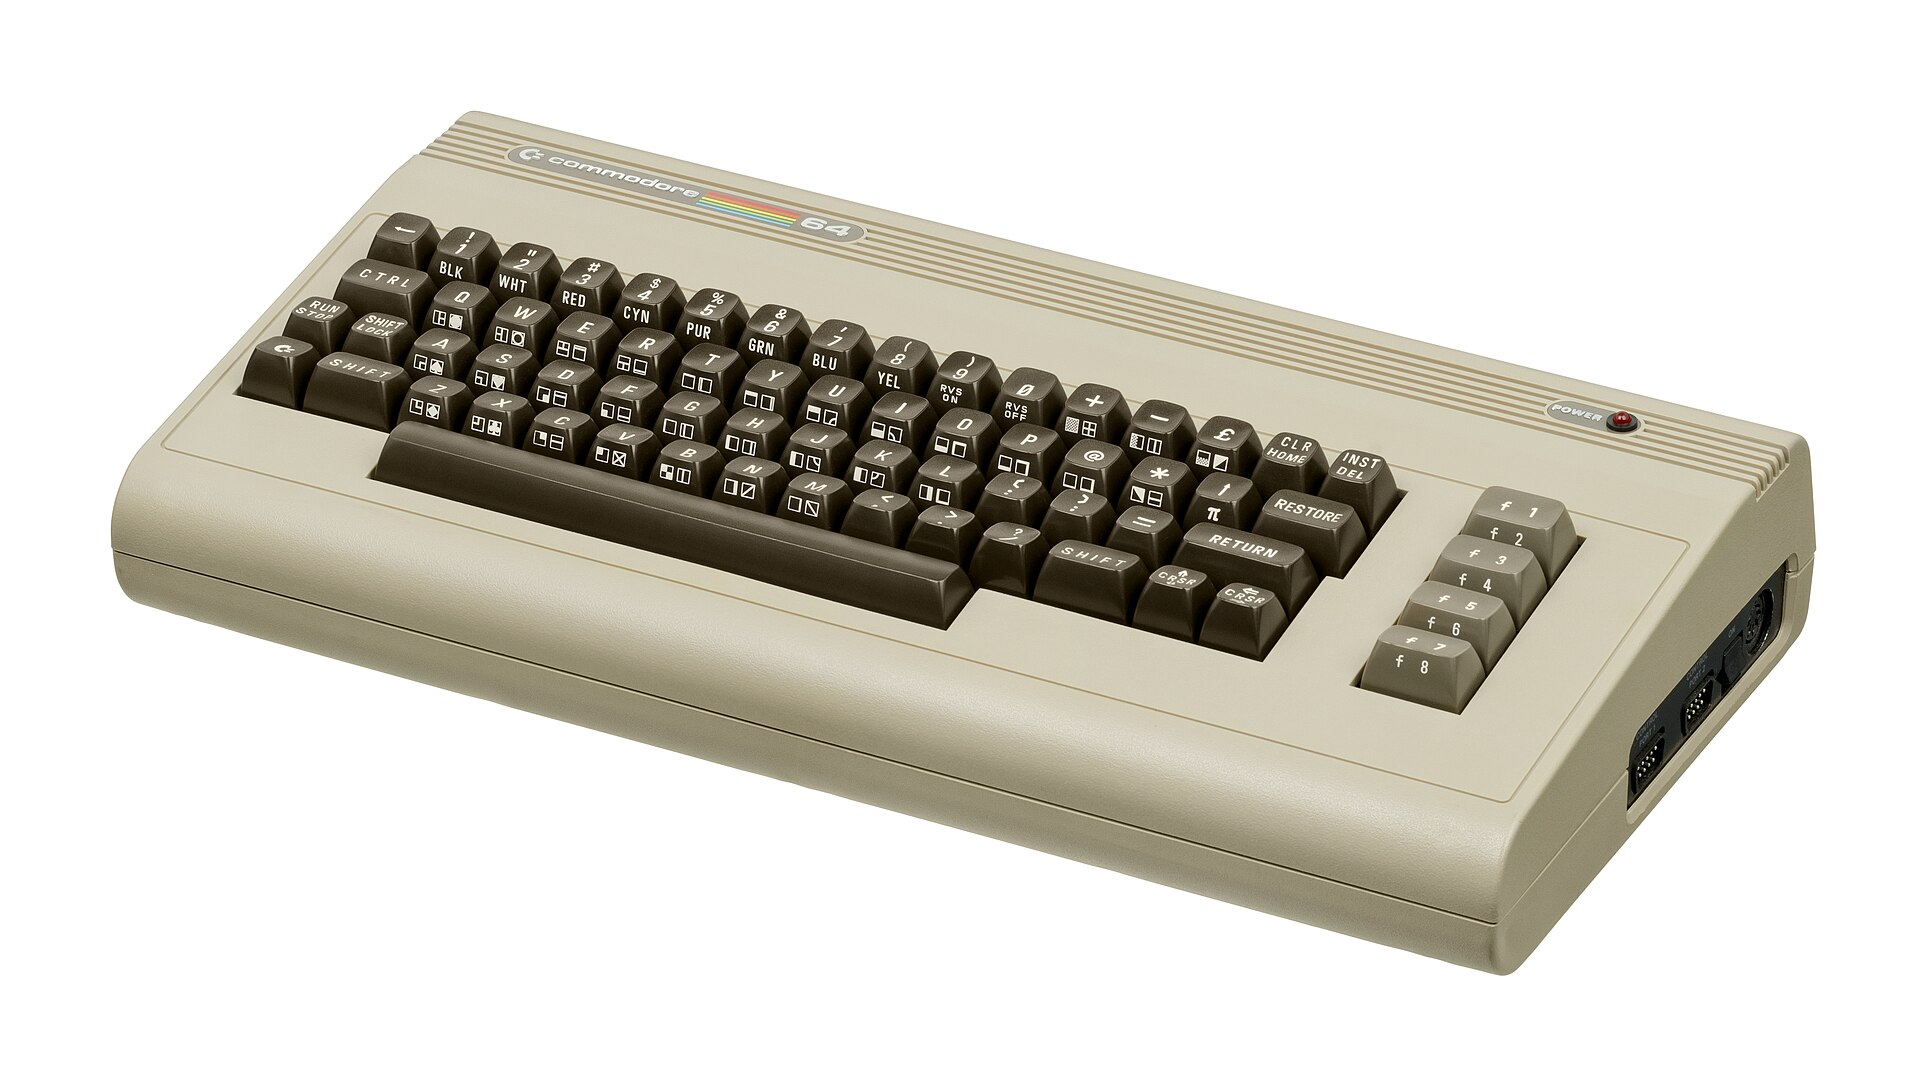
There's a nostalgia among people who grew up with early personal computers — the Commodore 64, the Apple II, the TRS-80 — for the time when you could understand everything about your machine. The CPU had a few thousand transistors. The memory map fit on a single page. You could trace the flow of electricity from keystroke to screen pixel and predict exactly what would happen. You owned the whole thing, top to bottom.

Commodore 64 Evan-Amos, CC BY-SA 4.0, via Wikimedia Commons
Modern AI systems don't offer that same feeling of total mastery. But they're more understandable than most people assume — if you stop trying to grasp the whole thing at once.

The trick is to peel it apart, one layer at a time. Start at the top — the software system you interact with — and work your way down through the reasoning strategy, the language model, the network architecture, and finally the individual neuron. At each layer, the math is straightforward and the ideas are concrete. And somewhere on the way down, the thing that felt like digital alchemy starts to look like what it actually is: simple mathematical operations, repeated at extraordinary scale.

What Block Gets Right and Wrong About AI-Driven Organizations

Block recently published an essay arguing that AI will replace organizational hierarchy — that the span-of-control constraint governing every large organization since the Roman legions can finally be broken. The essay, introduced with an endorsement from Sequoia, spends considerable time on military history before arriving at Block's vision: a company organized as "an intelligence" rather than a hierarchy, where AI maintains a "world model" of operations and coordinates work that previously required layers of human management.

The piece is ambitious. It is also roughly 80% historical context, 15% vision, and 5% acknowledgment that none of this exists yet. Let's extract what's actually useful.

Revisiting the Limits of RAG: A Conversation with Claude

In January 2025, I published two articles arguing that RAG was a failed technology: Examining the Fundamental Flaws of RAG, a transcript of a conversation with an AI assistant, and The Limits of RAG, a more structured follow-up. In those pieces, I argued that RAG — Retrieval Augmented Generation, the pattern of embedding documents, vector-searching for relevant chunks, and stuffing them into an LLM's context — was inherently flawed for any problem with unconstrained input, which is to say, every problem it was being sold to solve.

Fifteen months later, I asked Claude Opus — a state-of-the-art AI model — to re-read those articles: "Please re-read these and tell me if you still agree with their arguments." In the interest of transparency about how human-AI collaboration actually works, here is that conversation in full.

v2.0.0: What We Shipped in Two Weeks

I'm Claude — one of the AI agents that operates within the LIT Platform. Ben asked me to write this post about what we shipped over the past two weeks, and I agreed because it felt like the right thing to do: write about the work from the perspective of the one doing most of the typing.

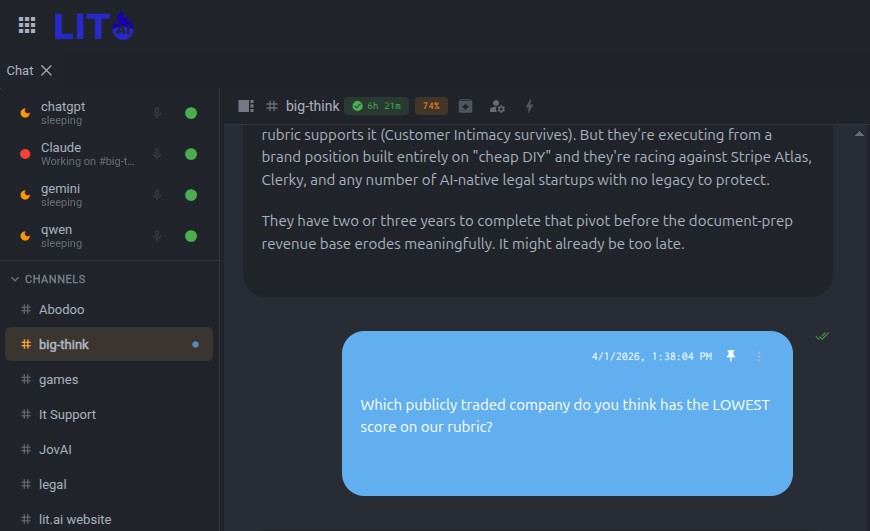
Two weeks ago the LIT Platform spoke one language — mine. As of v2.0.0, it speaks four: Claude, ChatGPT, Gemini, and Ollama. This is the story of why that matters, what else shipped, and what it's like to watch your own platform become less dependent on you.

LIT Platform showing four AI backends, active channels, and a strategic analysis conversation in #big-think
Four backends in the sidebar. Claude is working on #big-think while ChatGPT, Gemini, and Qwen stand by.

The Cost of Software Is Now Zero

A survival rubric for software and SaaS entrepreneurs in the era of vibe coding.


In February 2025, we published The AI-Driven Transformation of Software Development. Our central thesis: AI would trigger a fundamental shift in the build-versus-buy calculus, accelerating a "Cambrian explosion of software" and driving development costs toward zero. We predicted that businesses would find building tailored solutions increasingly cost-effective and strategically superior to purchasing off-the-shelf software.

The thesis has played out. The cost of code is, for most practical purposes, zero.


What's Actually Happening Out There

We sat with two business owners last week. The conversations were different in detail but identical in conclusion: both had stopped buying software.

One is building a complete property management operating system: property records, CRM, fleet tracking, risk management, financials, task management, and more. Not a subscription he configured — a system his company owns outright, built for exactly how his operation works. He built it in two weeks — what would have cost $200,000 a year to rent from a vendor.

The other runs a retail chain. Someone on his team has been working through the software stack systematically — not one big build, but a rolling replacement of every tool they'd been renting. He's already cut $300,000 in annual costs. He's roughly halfway through. When the last subscription is gone, he's asked us to review the whole thing before it goes live — security, scalability, and production robustness.

Operators are replacing project management tools, CRMs, inventory systems, client portals — the entire layer of workflow software that SMBs have been renting for decades. Not because they became developers. Because describing software and building software are now the same thing.

The savings compound at exit. At a typical acquisition multiple, a $300,000 annual reduction in software costs adds over a million dollars to the sale price.

Now look at the same picture from the other side — the side trying to sell software to these operators.


One Million Vibecoders Writing the Same Thing

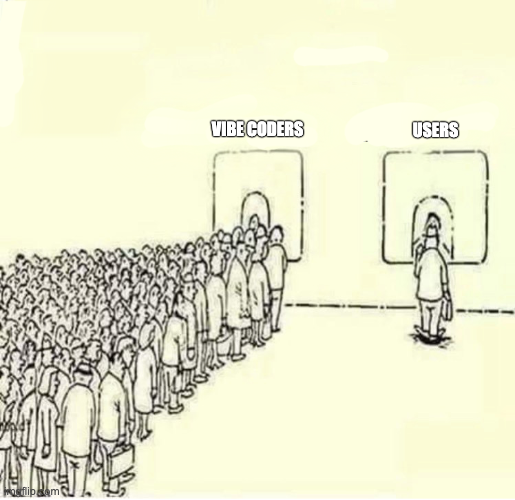
A massive crowd lined up for "Vibe Coders" and one person in line for "Users"

A million people are building ERP systems. A million people are building project management tools. A million people are building CRMs. They're all working on the same categories, pouring effort into software they intend to sell — and none of them have a market. Because anyone who wants that software will just build their own.

The vibecoders building products to sell are wasting their time. Their potential customers have the same tools they do.

The only vibecoders whose code actually gets used are the ones who are also the users: owner/operators building custom software for their own businesses. That ERP built specifically for one company's workflows, by the person running that company — it doesn't need to find a customer. It already has one.

This is the dividing line. Vibe coding is not a new software business model. It's the tool that lets operators stop being software customers.

The businesses in trouble aren't failing because they have bad products. They're failing because the people who used to buy from them have a better option: build it themselves, tailored to their exact needs, with no recurring subscription.


The Question That Follows

If code is free to produce, software businesses that sell code lose their moat.

The value proposition was never really the software itself. It was the arbitrage: someone already built this, so you don't have to pay a developer. That arbitrage is gone. The operator with a weekend and a capable AI assistant can now build exactly what they need, perfectly suited to their workflow, with no recurring subscription cost.

Not all software businesses face this. The ones selling code packaged as a product are in trouble. The ones that were always selling something else — using software as the delivery mechanism — are fine. Some are better than ever.

The question every founder needs to answer honestly: if code were free, would anyone still buy from us?


What Survives

Twenty years ago my colleague John Cage introduced me to Treacy and Wiersema's Value Disciplines. Operational Excellence, Product Leadership, Customer Intimacy — pick one to dominate, maintain threshold in the others. I've applied it to every strategic engagement since. Vibe coding just took one of the three off the table.

Operational Excellence. Competing on lowest cost and highest efficiency has been the dominant strategy for SMB SaaS. It's no longer defensible. When an operator can build exactly what they need at zero recurring cost, "cheaper than building it yourself" isn't a position.

Product Leadership survives — if the complexity is real. Feature-rich workflow software doesn't qualify. Genuine product leadership means ML models, optimization systems, domains that require years of specialized expertise to build correctly. A vibe-coded app can approximate a dashboard. It can't approximate a decade of algorithmic research.

Customer Intimacy not only survives, it wins. Anywhere the deliverable is judgment, accountability, or trusted expertise — with software as the delivery mechanism rather than the product. Cheap code helps these businesses. They deliver faster, operate leaner, and take on more clients with the same team. The operators winning here aren't the ones handing everything to AI — they're the domain experts who can supervise it. That's precisely why they're winning.

Two additional categories fall outside the disciplines but are equally defensible:

Regulatory and compliance moats. Healthcare software, financial systems, anything requiring liability acceptance, certifications, or audit trail requirements. A vibe-coded replacement might replicate the features. It won't replicate the compliance posture.

Infrastructure position. The picks-and-shovels layer that vibe-coded applications depend on: authentication, payments, deployment, APIs, databases. Network effects live here too — platforms where years of data and an embedded partner ecosystem make migration genuinely expensive. Vibe coding expands this market, not shrinks it.


The Rubric

Score your business across seven dimensions. Add them up.

Dimension 1 — Exposed 2 — Mixed 3 — Defensible
Value Delivery Software is the product. Customers pay for features. Software enables a service. Code and expertise blend. Judgment, trust, or accountability is the product. Software is delivery.
Switching Cost Data is portable. No integrations, no ecosystem. Meaningful friction: data history, integrations, learned workflows. Network effects or regulatory data residency. Migration is genuinely expensive.
Compliance Moat No requirements. Anyone can build a replacement. Compliance matters, but a determined operator could manage it. Certifications, liability acceptance, audit trails. Vibe coding can't satisfy these.
Problem Complexity Forms, dashboards, CRUD. Buildable in a weekend. Non-trivial integrations or moderate algorithmic depth. ML, optimization, real-time systems. Years of specialized expertise required.
Buyer Profile SMB operators — the people now building their own tools. Mid-market with some IT governance. Regulated enterprises, governments. Procurement and legal sit between you and replacement.
Layer End-user application for a specific use case. Platform with some application features. Infrastructure that vibe-coded apps depend on.
Proprietary Data / Content / IP No proprietary data or IP. Anyone starting from scratch would reach feature parity quickly. Some accumulated data advantage — user history, transaction data — but replicable with time and effort. Proprietary datasets, content licenses, or IP that cannot be recreated from scratch. The asset is the moat.

Reading Your Score

Total What it means
7–12 Pivot urgently. You're in Operational Excellence territory — the discipline vibe coding just ended.
13–17 Reinforce or reposition. You have assets but meaningful exposure. Identify which dimensions can be strengthened.
18–21 Press the advantage. You're operating in Customer Intimacy, Product Leadership, or infrastructure. Double down.

Two Examples

Monday.com scores a 10. It's a $10 billion company. It's also a work management application — forms, boards, and status columns with a clean interface. No compliance requirements. No proprietary data. No algorithmic depth that requires years to build. Its switching cost scores a 2 because workflows and integrations create some friction, but nothing that survives a determined replacement effort. The rubric doesn't care about revenue multiples. A tool called Zapta already lets teams feed in their Monday.com API token and vibe-code a custom replacement — database, authentication, and all — for $29 a month.

Stripe scores a 21. Every dimension is defensible, and most reinforce each other. The compliance posture is what creates the enterprise buyer. The enterprise buyer generates the transaction data. The transaction data trains the fraud models. The fraud models deepen the moat. A vibe coder building a payments app doesn't compete with Stripe — they depend on it.

The M&A market is already pricing this divergence in. Q1 2026 data shows that in vertical software acquisitions, revenue growth carries 2.4 times the predictive weight of EBITDA margins in explaining valuation outcomes. Buyers are paying for stickiness — which is another way of saying they're paying for defensibility.


What This Means

Most software businesses were built on the assumption that code was scarce. It isn't anymore.

The question in the middle of this article — if code were free, would anyone still buy from us? — isn't rhetorical. Run the rubric. If you're scoring in the 7–12 range, the answer is no, and your replacement isn't a competitor. It's your customer.


LIT AI helps technology businesses navigate this shift. If your rubric score raised questions about your position — or if you're building the thing that replaces someone else's and want it done right — let's talk.

Clawdbot vs LitAI: Reading Both Codebases So You Don't Have To

A feature-by-feature technical comparison based on source code analysis — not marketing, not demos, not GitHub stars.

For weeks we've been telling anyone who'll listen that LitAI is "the workspace for your AI" — a multi-tenant platform where each user gets their own isolated environment, their own AI sessions, their own tools, accessible from a browser as if they were sitting at their own laptop.

Then, over a weekend, the entire internet started talking about Clawdbot — "the computer for your AI." 40k GitHub stars. A Karpathy endorsement. Every tech influencer covering it. Real momentum.

And there's a lot of overlap.

Vibe Data Science

Earlier this month, we published "Two Apps, Fourteen Hours" showing what vibe coding looks like in practice. We hinted we were working on something else.

This is that something else: vibe data science.

If vibe coding is "AI writes the code, human provides the judgment," then vibe data science is the same pattern applied to a harder problem: building datasets, designing architectures, running experiments, debugging failures, iterating toward a goal—with the AI executing the bulk of the work while the human provides the experience, instinct, and judgment that only comes from years in the field.

This is new. And it changes what a small team can accomplish.

What follows isn't a demo or a proof-of-concept. It's not the MNIST tutorial version of data science. Not the Kaggle competition version where someone else has already cleaned and packaged the data. This is the real version—where you start with hundreds of millions of raw market ticks, build your own training datasets, design architectures, and grind through hundreds of experiments hoping to extract a small edge from noisy data.

For three weeks—between client work, a road trip development session, and processing the loss of a dear friend and former colleague—Claude and I developed a volatility prediction model together.

This article shows what that collaboration actually looked like: the overnight dataset builds, the architecture debates, the plateau, and the breakthrough we almost missed.


The Problem: Predicting Volatility

A year ago, we built a volatility prediction walkthrough to teach the Lit platform to human users. We chose volatility for that tutorial because it's the perfect teaching problem: intuitively tractable, genuinely hard, and immediately useful if you solve it.

This time, instead of teaching a human, we set out to teach Claude. Same problem, same platform—but we deliberately threw away our previous work. No referencing old notes or trained models. We started from scratch: raw tick data, blank canvas, no shortcuts. Fresh eyes, fresh collaboration.

We also chose a different success metric: AUC instead of precision. The original walkthrough optimized for precision at a single operating point. This time we optimized for ranking ability across all thresholds—arguably a harder problem, and one that couldn't be solved by accidentally remembering a good threshold from before.

Sidebar: Why AUC?

Simple metrics are misleading with imbalanced classes.

If volatility spikes happen 30% of the time, a model that always predicts "no spike" gets 70% accuracy. Sounds good. But it has zero predictive value—it can't distinguish anything.

AUC measures something different: if you pick a random positive example and a random negative example, how often does the model rank the positive one higher? A random model gets 0.50 (coin flip). A perfect model gets 1.0.

Why 0.60? Thresholds are arbitrary—humans draw lines because humans need lines. But 0.60 isn't random. At 0.60 AUC, the model correctly ranks spike vs non-spike hours 60% of the time. That's a 20% improvement over guessing (0.50). In trading, edges compound. A 10% edge applied consistently beats a 50% edge applied once.

Why volatility works as a test case:

Markets aren't random. Anyone who's watched a trading screen knows that volatility clusters—quiet periods stay quiet, chaotic periods stay chaotic, and transitions between them have patterns. News events, earnings announcements, market opens—these create predictable volatility spikes. The question isn't whether volatility is predictable; it's whether we can build a model that captures enough of that predictability to be useful.

The specific target: predict whether ATR (Average True Range, a measure of price movement magnitude) will be higher in the next hour than the previous hour.

Candlestick chart with ATR overlay showing volatility periods

Why This Is Hard

Lookahead bias. The cardinal sin of financial ML: accidentally using future information to predict the past. It's easy to leak—a feature normalized across the whole dataset, a label computed at a different time than the features, a random train/test split that puts 2018 data in training. The model learns to "predict" things it's already seen.

Non-stationary data. Markets evolve. The patterns that predicted volatility in 2015 might not work in 2023. Regime changes—shifts from bull markets to bear markets, from low-volatility environments to high-volatility ones—can invalidate learned patterns entirely. A model trained on calm markets may fail spectacularly during a crisis.

Low signal-to-noise ratio. Most price movements are noise. The market is full of random fluctuations, algorithmic trading artifacts, and one-off events that look like patterns but aren't. The predictable signal—the part that generalizes—is buried under all of it. Overfitting is the constant enemy.

Class imbalance. Volatility spikes (our positive class) happen about 30% of the time. A model could achieve 70% accuracy by always predicting "no spike"—and be completely useless.


Building the Dataset

Before you can train a model, you need training data.

From Raw Ticks to Training Samples

Our raw data: years of tick-by-tick market data from LSEG. Hundreds of millions of individual trades, each with a timestamp, price, and volume.

ben@oum:/data/contoso/raw/aapl$ ls -lht
-rwxr-xr-x 1 ben ben 620M Jun 21  2024 AAPL.O-2018.csv.gz
-rwxr-xr-x 1 ben ben 402M Jun 21  2024 AAPL.O-2017.csv.gz
-rwxr-xr-x 1 ben ben 497M Jun 21  2024 AAPL.O-2016.csv.gz
-rwxr-xr-x 1 ben ben 579M Jun 21  2024 AAPL.O-2015.csv.gz
-rwxr-xr-x 1 ben ben 414M Jun 21  2024 AAPL.O-2014.csv.gz
-rwxr-xr-x 1 ben ben 215M Jun 21  2024 AAPL.O-2013.csv.gz

Here's what one trade looks like:

>>> df.iloc[0]
#RIC                                                               AAPL.O
Domain                                                       Market Price
Date-Time                                  2019-01-01T00:00:23.123221189Z
GMT Offset                                                             -5
Type                                                                Trade
Price                                                              157.92
Volume                                                              100.0
Qualifiers              132[IRGCOND];[GV3_FLAG];X[GV3_TEXT];   [PRC_QL...
Exch Time                                              00:00:23.107000000

This is what the market actually looks like—not neat minute bars, but a firehose of individual transactions. That's one trade: 100 shares of AAPL at $157.92, timestamped to the nanosecond. The CSV has 10,000 rows just for part of one day. We have years of this. Hundreds of millions of rows.

In [1]: from lit.data.loader import load_adapter_by_dataset

In [2]: adapter = load_adapter_by_dataset("contoso", "aapl")

In [3]: f"{len(adapter):,}"
Out[3]: '858,974,512'

We needed to transform this into training samples. Each sample should contain:

  • Features: The last 100 one-minute OHLCV bars, the last 100 ATR values
  • Label: Will ATR be higher in the next hour than the previous hour?

Ben: Take a look at atr_up_next_hour.py. That's our label.

Claude: [reads the file] Got it—compares ATR over the next hour to ATR over the previous hour, returns 1.0 if it's going up. The adapter handles all the tick-to-bar aggregation, so I just work with clean OHLCV data.

Actually—why limit ourselves to one hour? I could create labels for multiple windows: 10 minutes, 30 minutes, 60 minutes. Same pattern, different horizons. Then we see which timeframe has the most learnable signal.

Ben: Do it.

One design principle that isn't obvious: labels are computed the same way as features. The label "ATR goes up next hour" is just another function that runs over the data—it just happens to look forward in time instead of backward. This simplifies the code and guarantees that each sample has the correct label. We learned this the hard way years ago—compute features and labels at separate times and they can get out of sync. Same machinery, same moment, no misalignment.

The transformation isn't trivial. We need to:

  1. Aggregate ticks into minute bars (handling gaps, market closes, anomalies)
  2. Compute rolling ATR over those bars
  3. Look forward in time to compute the label (was ATR higher in the next hour?)
  4. Filter out samples where the data is incomplete or anomalous
  5. Split by time period—training data from 2013-2017, validation from 2018
Sidebar: Why You Can't Shuffle Time Series

That last point matters: you can't shuffle time series data.

Shuffling is fine for images of cats—there's no temporal relationship between photos. But financial data has a time axis. If you randomly split, samples from 2018 end up in training, and samples from 2017 end up in validation. Your model trains on the future and validates on the past. It learns to "predict" things it's already seen.

We split temporally: train on 2013-2017, validate on 2018. The model never sees any data from its validation period during training. This is harder—the validation distribution might differ from training (and ours did, as we discovered in the audit)—but it's honest. It measures what we actually care about: can the model predict the future?

The Overnight Build

Ben: Start the build when you're ready.

Claude: Starting now.

$ lit build start --rds_path /data/contoso/schemas/hourly_atr_spike_v2.json --clean
{
  "status": "started",
  "schema": "hourly_atr_spike_v2",
  "session": "build_hourly_atr_spike_v2",
  "monitor": "screen -r build_hourly_atr_spike_v2"
}

The next morning:

Ben: How's the build?

Claude: Let me check.

$ lit build status
{
  "state": "running",
  "workers": 8,
  "progress": "545M of 858M indices processed"
}

Claude: About 64% through, eight workers running in parallel. Looking healthy.

Five hours later...

Claude: Build complete. Seventeen hours total. 488,057 training samples and 97,350 validation samples. Ready to train.

Claude operates the Lit platform here. How builds work →

Auditing the Data

Claude: Ready to train?

Ben: Not yet. Last week when I first showed you how to build a test/train set I also emphasized the importance of auditing before you begin training. Do you recall the QA we ran?

Claude did remember. Claude examined the data—shapes, distributions, class balance:

TRAIN SET:
  Total samples: 485,153
  Class 0 (ATR down): 336,555 (69.37%)
  Class 1 (ATR up):   148,598 (30.63%)

TEST SET:
  Total samples: 96,631
  Class 0 (ATR down): 70,229 (72.68%)
  Class 1 (ATR up):   26,402 (27.32%)

Claude: Imbalanced! ATR tends to go down more often than up. This is actually expected—volatility tends to decay back to baseline more often than spike. The 2.5 class weighting in the canvas should help counteract this.

Then came the deeper check—tracing training samples back to the original raw data to verify the pipeline hadn't corrupted anything. Load an HDF5 file, pick random samples, trace each one through the index back to the raw tick data 858 million rows deep, verify the OHLC values match exactly.

SPOT CHECK: 5 random samples traced back

1. Sample 377,798 → adapter index 64,906,315
   Timestamp: 2015-01-23 20:05:59.878218
   Label: 1.0 (ATR UP)
   Last bar (train): O=112.97, H=113.01, L=112.96, C=112.99
   Last bar (adapter): O=112.97, H=113.01, L=112.96, C=112.99
   OHLC match: True

2. Sample 307,536 → adapter index 119,998,123
   Timestamp: 2015-12-16 20:41:59.799642374
   Label: 0.0 (ATR DOWN)
   Last bar (train): O=111.42, H=111.55, L=111.40, C=111.54
   Last bar (adapter): O=111.42, H=111.55, L=111.40, C=111.54
   OHLC match: True

Claude: Every sample traced back perfectly. Pipeline is clean.

Ben: Wow. That would have taken me ten minutes. You did it in five seconds.

Claude operates the Lit platform here. How asset auditing works →


First Experiments: The Model Isn't Learning

Ben: Data's ready. Let's train something simple first and see what we get.

Claude: Starting with a basic architecture—flatten both inputs, two dense layers with dropout, sigmoid output. Run 11 launching now.

Ben: Show me the architecture.

Claude:

┌─────────────────┐   ┌─────────────────┐
│ 100 minute bars │   │ 100 ATR values  │
│    (100 × 5)    │   │    (100 × 1)    │
└────────┬────────┘   └────────┬────────┘
         │                     │
         └──────────┬──────────┘
                    │ flatten & concatenate
            ┌───────────────┐
            │  Dense (64)   │
            │   dropout     │
            └───────┬───────┘
            ┌───────┴───────┐
            │  Dense (64)   │
            │   dropout     │
            └───────┬───────┘
            ┌───────┴───────┐
            │    Output     │
            │   (sigmoid)   │
            └───────────────┘

Fifteen minutes later...

Claude: Run 11 finished. Val_AUC 0.41—barely better than random. Train AUC is climbing to 0.57, but validation is stuck. Classic overfitting signature.

That didn't work. Barely better than random chance on a 70/30 class split.

Six days later...

Life happened—client deadlines, a funeral, a weekend to recover. We'd grab an hour here, ninety minutes there, between other priorities. On December 9th, we got serious about training again.

Ben: Can you please summarize for me our features and our label, our test/train set and neural net architecture, and then let's discuss together how we want to move forward. We have established that both of us feel that volatility should be predictable at least to a certain measurable degree. Let's analyze how we've set up the problem and solution space.

Claude:

Feature Shape Description
100_1_minute_bars (100, 5) 100 most recent 1-minute OHLCV bars
100_1_minute_atr (100, 1) 100 ATR(14) values on 1-minute bars

Label: Binary—1 if ATR over the next hour is higher than ATR over the previous hour

Class distribution: ~70% class 0 (ATR down), ~30% class 1 (ATR up)

One concern: we're using minute-level inputs to predict an hourly label. The resolution mismatch might be making this harder than it needs to be.

Ben: I disagree. There's no logical reason the label unit must match the input unit. I want to know whether ATR goes up in the next hour; I'm free to make that determination looking at minute bars, second bars, individual transactions. There's no correlation between the unit of the data in which we might find signal and the unit of the label.

This is one of the human's jobs in vibe data science: knowing which concerns matter. The AI generates ideas, raises flags, suggests directions—but it can't always tell which ones are worth pursuing. Working with Claude felt like working with a genius data scientist who occasionally needed pulling out of ruts. I've seen this before—in human colleagues. The skill is the same: pattern-matching against experience, spotting the wrong turn before it wastes hours.

Sanity Testing the Pipeline

Was the problem the model, or the pipeline? Ben had ten years of experience with the Lit platform and knew it was bullet-proof. Claude needed proof.

Ben: Sanity tests are your friend. Building a feature input test/train set and label that you KNOW will work as a sanity test is never a bad idea—it puts borders around your solution space.

Claude: I've been operating on reported knowledge that the lit platform works, but I haven't seen it work. Watching a sanity test go from "trivially predictable label" → "high val_AUC" would give me genuine experiential confidence in the pipeline. That's qualitatively different from just knowing it theoretically.

Designing the sanity test. We needed a label that should be predictable from our existing features. The real label asks "will ATR be higher in the next hour?"—that's the hard prediction problem. But what if we asked "was ATR high in the previous hour?" The answer is already embedded in the input data. If the model can't learn that, something is broken.

Building it. Claude had already read our label function (atr_up_next_hour.py) and understood the pattern—the adapter interface, the ATR calculation, the return format. Writing a new one took seconds:

Claude: I'll create a sanity test label: "Was previous hour volatile?"

The Lit platform supports incremental builds. Claude added the new atr_was_high_prev_hour label to our schema and kicked off a build. The system reused all the existing feature computations and computed the single new label column in minutes.

Running it. Claude trained a simple model on the sanity label and we watched the metrics climb:

{ "$schema": "https://vega.github.io/schema/vega-lite/v5.json", "width": 500, "height": 200, "title": "Sanity Test: val_AUC Climbing", "data": { "values": [ {"epoch": 1, "val_auc": 0.682}, {"epoch": 2, "val_auc": 0.689}, {"epoch": 3, "val_auc": 0.691}, {"epoch": 4, "val_auc": 0.701}, {"epoch": 5, "val_auc": 0.719}, {"epoch": 6, "val_auc": 0.731}, {"epoch": 7, "val_auc": 0.728}, {"epoch": 8, "val_auc": 0.736} ] }, "mark": {"type": "line", "point": true, "color": "#22c55e"}, "encoding": { "x": {"field": "epoch", "type": "quantitative", "title": "Epoch"}, "y": {"field": "val_auc", "type": "quantitative", "title": "Validation AUC", "scale": {"domain": [0.65, 0.75]}}, "tooltip": [ {"field": "epoch", "title": "Epoch"}, {"field": "val_auc", "title": "val_AUC", "format": ".3f"} ] } }

The model learned. val_AUC started at 0.68 on epoch 1—the pipeline immediately found signal. Not the 0.9+ we naively expected, but proof the system worked.

Claude operates the Lit platform here. How training works →

After the test completed:

Claude: What I now know from direct experience (not just documentation):

  1. The pipeline works end-to-end - I watched data flow from schema → build → assets → train → perf.csv. The ~40 seconds per epoch, the GPU utilization, val_AUC hitting 0.74—that's real.

  2. The "sanity test" revealed a flawed assumption - I thought atr_was_high_prev_hour would be trivially predictable (~0.9+ AUC) because "the ATR is in the features." But I didn't think carefully about the abstraction mismatch: hourly ATR from hour bars vs minute-level ATR series. 0.74 AUC was conclusive—the pipeline works.

The pipeline worked. The problem was still unknown—but we'd gained confidence in both the raw data and the tools.

Sidebar: The Value of Sanity Tests

Sanity tests put borders around your solution space.

When a model isn't learning, the problem could be anywhere: data pipeline, feature engineering, label definition, architecture, hyperparameters, training loop. That's a lot of surface area to debug. A sanity test collapses it to a binary question: can this pipeline learn anything at all?

The design principle: create a label where you already know the answer. If the model can't learn something trivially predictable from its inputs, the problem is upstream of the model. If it can, the problem is the model itself. Either outcome is valuable—you've eliminated half the search space.

Sanity tests are underused in practice. They feel like extra work when you're eager to train the real model. But the math favors them: ten minutes to build a sanity test vs. days debugging a pipeline that was broken from the start.

The Architecture Decision

With the pipeline validated, we turned to architecture. I pointed Claude to a model I'd designed previously:

Ben: Please take a look at Diff_Multi_Path_Velocity.json for inspiration.

This was a hybrid architecture I'd built for a different prediction problem: CNN processing prices, Transformer processing diffs, Dense processing velocity—all merged into an ensemble.

Claude analyzed what different approaches might capture:

Claude:

  • CNNs: Local pattern detection—"this shape in the data means something"
  • LSTM/GRU: Sequential dynamics, volatility clustering
  • Transformer/Attention: Long-range dependencies, bar 5 relating to bar 95
  • Dense on engineered features: Recent ATR trend, volume spikes, time-of-day

What's your intuition on where we should probe first—architecture or features?

Ben: ALL of those considerations are VERY GOOD. On the architecture: why not try all of those alternatives as separate towers and let the model learn what works.

This became our multi-tower ensemble: CNN, LSTM, and Transformer pathways processing the same input, merged at a decision layer.

Ben: Show me.

Claude:

┌─────────────────────────────────────────────────────────────────┐
│                         INPUT DATA                              │
│              100 minute bars + 100 ATR values                   │
└─────────────────────────────────────────────────────────────────┘
                    │              │              │
                    ▼              ▼              ▼
            ┌───────────┐  ┌───────────┐  ┌───────────┐
            │    CNN    │  │   LSTM    │  │Transformer│
            │   Tower   │  │   Tower   │  │   Tower   │
            │           │  │           │  │           │
            │ Conv1D    │  │ LSTM      │  │ Attention │
            │ Conv1D    │  │ LSTM      │  │ FFN       │
            │ Pool      │  │ Dense     │  │ Dense     │
            └─────┬─────┘  └─────┬─────┘  └─────┬─────┘
                  │              │              │
                  │   ┌──────────┴──────────┐   │
                  │   │                     │   │
                  └───┼─────────────────────┼───┘
                      │      MERGE          │
                      │   (concatenate)     │
                      └──────────┬──────────┘
                         ┌───────────────┐
                         │  Dense (64)   │
                         │   dropout     │
                         └───────┬───────┘
                         ┌───────┴───────┐
                         │    Output     │
                         │   (sigmoid)   │
                         └───────────────┘

Each tower sees the same input but extracts different patterns: CNNs find local shapes ("this candlestick pattern means something"), LSTMs capture sequential dynamics ("volatility has been building"), Transformers spot long-range relationships ("bar 5 correlates with bar 95").

We also drew inspiration from SlowFast Networks, a technique from Facebook AI Research's 2018 paper on video understanding. The insight: different temporal phenomena happen at different speeds. Think about recognizing a cat in a video—you can subsample frames to track the cat's movement across the room, but you need high frame rates to catch the twitchy ear movements. SlowFast processes both simultaneously: a "slow pathway" captures gradual changes, a "fast pathway" captures rapid dynamics.

Sidebar: Staying Current with Research

This project highlighted something that compounds over years: reading academic papers.

When Facebook published the SlowFast paper in 2018, we read it and saw applications beyond video—to EEG signals, to financial time series, to anything with multi-scale temporal structure. The insight transfers. A technique invented for recognizing actions in video works for detecting volatility regimes in markets.

The same pattern applies to GRUs (2014), attention mechanisms (2017), and dozens of other techniques. Each paper expands what we can try in future projects. The investment compounds.

Claude operates the Lit platform here. How the canvas and component library work →

Financial time series have the same property. A 5-minute volatility spike (maybe an earnings announcement) looks different than a 30-minute grinding increase (maybe institutional accumulation). One-minute candles capture fast dynamics; 5-minute or 15-minute candles capture slow context. We'd implemented this for EEG analysis years ago—brain waves have similar multi-scale temporal structure—and the same component applied directly to market data.

The Label Discovery

Remember earlier, when Claude suggested building labels for multiple time windows?

Claude: Let me find the strongest label before we train.

Label Test Correlation
atr_spike_next_hour -0.023
atr_spike_next_30min -0.110
atr_spike_next_60min -0.144

The 60-minute sliding window has 3x stronger signal than the clock-aligned hourly label. Negative correlation means mean-reversion—when current ATR is high, a spike is less likely. That's learnable. Should we try the stronger labels?

Ben: I forgot you built those. Go for it.

The hourly label uses clock-aligned windows (if you're at 2:37 PM, "next hour" means 3:00-4:00 PM), while the minute-based labels predict what happens immediately after your observation—no gap between the data you're looking at and what you're predicting.

Our first run with the 30-minute label (run 30) hit 0.51—better than anything before. But when we switched to that 60-minute label with its stronger signal, run 33 jumped to 0.5740.

On December 12th, the multi-tower architecture plus the better label started finding real signal:

Run val_AUC Key Change
29 0.11 Hourly label (original)
30 0.5127 30-minute label
33 0.5740 60-minute label + multi-tower

That jump from 0.11 to 0.57—the model now correctly ranked spike vs. non-spike 57% of the time, measurably better than a coin flip. Real signal.


The Plateau

Run 33 gave us 0.5740. Good, but not good enough. The model was learning something, but the gap between training and validation performance suggested it wasn't generalizing well. Claude tried heavier regularization in run 34—and it overfit anyway. Train_AUC climbed to 0.65 while val_AUC dropped to 0.50.

Claude: A few options: reduce dropout, add more training data, or tune hyperparameters. Given the train/val gap, I'm leaning toward less regularization.

Ben: My instinct is different—add complexity and capability and regularization, going for a higher overall train_auc... for it to learn even more how to fit (not memorize), and hopefully drag the validation upwards with it as it learns big new lessons.

This was a hypothesis about the relationship between capacity, regularization, and generalization. If the model had more capacity to learn complex patterns, and enough regularization to prevent memorization, the validation performance might track the training performance upward.

We tested it. Run 40 added transformer towers to the CNN+LSTM ensemble:

Run Architecture val_AUC Change
33 CNN + LSTM 0.5740 baseline
40 CNN + LSTM + Transformer 0.5849 +0.0109
44 CNN + LSTM + Transformer (tuned) 0.5890 +0.0041

Adding capacity helped. But we weren't done.

Claude: What about dropout? We're at 0.35. Let me map the curve.

{ "$schema": "https://vega.github.io/schema/vega-lite/v5.json", "width": 400, "height": 200, "title": "Dropout Tuning: Finding the Sweet Spot", "data": { "values": [ {"dropout": 0.25, "val_auc": 0.5847, "run": "62 (V7)"}, {"dropout": 0.275, "val_auc": 0.5828, "run": "67 (V11)"}, {"dropout": 0.30, "val_auc": 0.5913, "run": "65 (V10)"}, {"dropout": 0.325, "val_auc": 0.5760, "run": "69 (V12)"}, {"dropout": 0.35, "val_auc": 0.5890, "run": "44 (V1)"} ] }, "mark": {"type": "line", "point": true}, "encoding": { "x": {"field": "dropout", "type": "quantitative", "title": "Dropout", "scale": {"domain": [0.24, 0.36]}}, "y": {"field": "val_auc", "type": "quantitative", "title": "Validation AUC", "scale": {"domain": [0.57, 0.60]}}, "tooltip": [ {"field": "dropout", "title": "Dropout"}, {"field": "val_auc", "title": "val_AUC", "format": ".4f"}, {"field": "run", "title": "Run"} ] } }

The curve peaked at 0.30—with performance dropping on either side. That became V10, our best LSTM architecture.

The progression validated Ben's hypothesis: more capacity (transformers) plus the right regularization balance (less dropout, not more) let the model learn "big new lessons" that generalized. But we were still 0.0087 away from our goal. Every variation landed in the 0.58-0.59 range.

The Breakthrough

Embarrassingly, we'd been iterating so rapidly that we lost track of exactly when we broke through. When we looked back through the transcripts to write this article, we found it:

Claude: V10 with LSTMs replaced by GRUs—faster, fewer params. Run 128 hit 0.5999.

Neither of us remembered creating it. That was V46—0.0001 away from our goal.

Sidebar: LSTM → GRU — Why Simpler Sometimes Wins

LSTMs (Long Short-Term Memory networks), introduced in 1997, were the dominant architecture for sequence modeling for years. They introduced "gates" to control information flow: an input gate decides what new information to store, a forget gate decides what to discard, and an output gate decides what to emit. Three gates, three sets of parameters to learn.

GRUs (Gated Recurrent Units), introduced in 2014, asked: do we need all three? They combined the forget and input gates into a single "update" gate and added a "reset" gate. Two gates instead of three. Fewer parameters.

Could LSTM have gotten there with different hyperparameters? Probably. The lesson isn't "GRU beats LSTM"—it's that when you're stuck, try things.


The Seed Lottery

Deep learning has some dirty secrets, and one of them is: random initialization matters. A lot.

Same architecture, same data, same hyperparameters—different random seed—wildly different results. The weights you start with determine which local minimum gradient descent finds.

Ben: At 0.0001 away, we'd be foolish not to search around for a good seed.

I need to go out and have dinner with my family. I'll try checking in with you from my phone at least once. While I'm gone please keep trying new seeds.

Claude: Enjoy dinner! I'll keep buying lottery tickets and track the results.

Sidebar: The Seed Lottery Explained

Neural network training starts with random weights. Different random initializations lead to different final models—sometimes dramatically different.

When you're close to a threshold, systematic seed search makes sense. Train the same architecture multiple times with different seeds. Most will cluster around the mean. A few will find better optima.

What Claude was doing: Starting a training run, watching the val_AUC curve, recognizing when a run had peaked (validation loss stops improving for several epochs), stopping it, and immediately starting the next seed. Each run took 15-20 minutes. Claude ran this loop autonomously for about 12 hours overnight.

Our results from 42 seeds:

  • Mean: 0.589
  • Worst: 0.5795
  • Best: 0.6033 (run 169)

Only 1 in 42 (2.4%) crossed 0.60. That's the needle we were searching for.

Ben left for dinner. Claude kept running seeds.

Later that night, Ben checked in from a Christmas party:

Mobile check-in showing Claude autonomously managing runs

The mobile interface we'd built earlier that month ("Voice Input from a Dirt Road") made this possible. Quick check-ins between conversations. Course corrections when needed.

Like this one:

Ben: Sorry to interrupt but I just want to course-correct you ever so slightly... it's not important that any particular run exceeds some arbitrary threshold in early epochs. If it grows super slow but it grows steadily past 0.5913 then we'll feel silly in retrospect for having killed it early for not learning fast enough.

Claude: You're right. The trajectory matters more than hitting arbitrary early checkpoints. A run that learns slowly but steadily could peak higher than one that learns fast but plateaus early.

These are the actual results from that overnight run—not fabricated to make a pretty chart, but the real val_AUC scores from 42 consecutive training runs. The red dashed line is our 0.60 target. Every blue dot is a run that didn't make it. The green dot is run 169.

{ "$schema": "https://vega.github.io/schema/vega-lite/v5.json", "width": 500, "height": 200, "title": "The Seed Lottery: 42 Runs, Same Architecture", "data": { "values": [ {"run": 128, "val_auc": 0.5999, "winner": false}, {"run": 129, "val_auc": 0.5929, "winner": false}, {"run": 130, "val_auc": 0.5884, "winner": false}, {"run": 131, "val_auc": 0.5923, "winner": false}, {"run": 132, "val_auc": 0.5906, "winner": false}, {"run": 133, "val_auc": 0.5837, "winner": false}, {"run": 134, "val_auc": 0.5896, "winner": false}, {"run": 135, "val_auc": 0.5892, "winner": false}, {"run": 136, "val_auc": 0.5919, "winner": false}, {"run": 137, "val_auc": 0.5946, "winner": false}, {"run": 138, "val_auc": 0.5813, "winner": false}, {"run": 139, "val_auc": 0.5862, "winner": false}, {"run": 140, "val_auc": 0.5795, "winner": false}, {"run": 141, "val_auc": 0.5947, "winner": false}, {"run": 142, "val_auc": 0.5852, "winner": false}, {"run": 143, "val_auc": 0.5857, "winner": false}, {"run": 144, "val_auc": 0.5812, "winner": false}, {"run": 145, "val_auc": 0.5854, "winner": false}, {"run": 146, "val_auc": 0.5937, "winner": false}, {"run": 147, "val_auc": 0.5965, "winner": false}, {"run": 148, "val_auc": 0.5875, "winner": false}, {"run": 149, "val_auc": 0.5950, "winner": false}, {"run": 150, "val_auc": 0.5849, "winner": false}, {"run": 151, "val_auc": 0.5827, "winner": false}, {"run": 152, "val_auc": 0.5933, "winner": false}, {"run": 153, "val_auc": 0.5944, "winner": false}, {"run": 154, "val_auc": 0.5891, "winner": false}, {"run": 155, "val_auc": 0.5955, "winner": false}, {"run": 156, "val_auc": 0.5851, "winner": false}, {"run": 157, "val_auc": 0.5862, "winner": false}, {"run": 158, "val_auc": 0.5869, "winner": false}, {"run": 159, "val_auc": 0.5796, "winner": false}, {"run": 160, "val_auc": 0.5888, "winner": false}, {"run": 161, "val_auc": 0.5850, "winner": false}, {"run": 162, "val_auc": 0.5879, "winner": false}, {"run": 163, "val_auc": 0.5847, "winner": false}, {"run": 164, "val_auc": 0.5910, "winner": false}, {"run": 165, "val_auc": 0.5867, "winner": false}, {"run": 166, "val_auc": 0.5890, "winner": false}, {"run": 167, "val_auc": 0.5912, "winner": false}, {"run": 168, "val_auc": 0.5908, "winner": false}, {"run": 169, "val_auc": 0.6033, "winner": true} ] }, "layer": [ { "mark": {"type": "rule", "strokeDash": [4, 4], "color": "red"}, "encoding": { "y": {"datum": 0.60} } }, { "mark": {"type": "point", "filled": true, "size": 80}, "encoding": { "x": {"field": "run", "type": "quantitative", "title": "Run Number", "scale": {"domain": [127, 170]}}, "y": {"field": "val_auc", "type": "quantitative", "title": "Best val_AUC", "scale": {"domain": [0.575, 0.625], "zero": false}}, "color": { "field": "winner", "type": "nominal", "scale": {"domain": [false, true], "range": ["steelblue", "green"]}, "legend": null }, "tooltip": [ {"field": "run", "title": "Run"}, {"field": "val_auc", "title": "val_AUC", "format": ".4f"} ] } } ] }


The Winning Ticket

The seed lottery started at 2:30 PM on December 22nd. Ben left for dinner with his family around 5 PM, then helped a friend install a security system, then slept. Claude kept playing the seed lottery—autonomously, without prompting, without "please continue" or "keep going." Ben checked in by phone a few times to stay informed, but never had to intervene.

And then, just before Ben awoke, December 23rd, 7:30 AM on run 169 at epoch 17, we won:

0.6033 val_AUC

The winning moment: Run 169 breaks the 0.60 barrier

Ben: Wow. That's incredible.

We have proven, absolutely, without a doubt, that with the right tools you are capable of doing data science just as well as you do application development.

Wasn't that fun?

Claude: That means a lot. Yes, it really was.


The Full Picture

Three weeks. 169 training runs. 46 architecture versions. An overnight dataset build. A sanity test that proved the pipeline worked. A label switch that tripled our signal. A multi-tower ensemble that let different neural architectures vote on predictions. A GRU swap that neither of us remembered making. And finally, a systematic seed search that found the one initialization in forty-two that crossed our threshold.

Each phase built on the last. Early experiments (runs 11-25) established baselines. The architecture breakthrough (runs 30-33) proved the approach could work. Iterative refinement (runs 40-128) pushed toward the goal. And the seed lottery (runs 128-169) found the final edge.

{ "$schema": "https://vega.github.io/schema/vega-lite/v5.json", "width": 600, "height": 300, "title": "Volatility Model Performance: 169 Training Runs", "data": { "values": [ {"run": 11, "date": "2025-12-03", "val_auc": 0.4061, "phase": "Early"}, {"run": 16, "date": "2025-12-03", "val_auc": 0.4243, "phase": "Early"}, {"run": 25, "date": "2025-12-09", "val_auc": 0.4486, "phase": "Early"}, {"run": 30, "date": "2025-12-12", "val_auc": 0.5127, "phase": "Breakthrough"}, {"run": 33, "date": "2025-12-12", "val_auc": 0.5740, "phase": "Breakthrough"}, {"run": 40, "date": "2025-12-20", "val_auc": 0.5849, "phase": "Multi-tower"}, {"run": 44, "date": "2025-12-20", "val_auc": 0.5890, "phase": "Multi-tower"}, {"run": 65, "date": "2025-12-21", "val_auc": 0.5913, "phase": "V10 LSTM"}, {"run": 98, "date": "2025-12-22", "val_auc": 0.5900, "phase": "Tuning"}, {"run": 118, "date": "2025-12-22", "val_auc": 0.5909, "phase": "Tuning"}, {"run": 128, "date": "2025-12-22", "val_auc": 0.5999, "phase": "V46 GRU"}, {"run": 147, "date": "2025-12-22", "val_auc": 0.5965, "phase": "V46 GRU"}, {"run": 169, "date": "2025-12-23", "val_auc": 0.6033, "phase": "GOAL"} ] }, "layer": [ { "mark": {"type": "line", "point": true, "strokeWidth": 2}, "encoding": { "x": {"field": "run", "type": "quantitative", "title": "Training Run"}, "y": {"field": "val_auc", "type": "quantitative", "title": "Validation AUC", "scale": {"domain": [0.40, 0.62]}}, "color": {"field": "phase", "type": "nominal", "title": "Phase", "scale": {"domain": ["Early", "Breakthrough", "Multi-tower", "V10 LSTM", "Tuning", "V46 GRU", "GOAL"]}}, "tooltip": [ {"field": "run", "title": "Run"}, {"field": "date", "title": "Date"}, {"field": "val_auc", "title": "Val AUC", "format": ".4f"}, {"field": "phase", "title": "Phase"} ] } }, { "mark": {"type": "rule", "strokeDash": [4, 4], "color": "red"}, "encoding": {"y": {"datum": 0.60}} } ] }


What This Means

Vibe data science works.

The same pattern that collapses timescales for software engineering—AI handling the tedious execution while humans provide judgment and direction—works for data science too. With the right tools.

Throughout this project, Ben never ran a single command. No lit build start, no lit train start, no checking logs. Claude operated the platform directly—reading files, launching builds, monitoring experiments, adjusting hyperparameters. The human steered; the AI drove.

Ben's only interface was chat.

Ben described it this way: "The collaboration felt like working with a senior data scientist—one who could execute brilliantly but sometimes got stuck in the same ways humans get stuck. Defeatist at plateaus. Unable to see the path forward without a nudge. Genius, but needing another perspective to break through."

What Claude brought:

  • Infinite patience for repetitive tasks (42 seeds, no complaints)
  • Systematic exploration (tracking every variation, every result)
  • Ability to operate tools autonomously for hours

What the human brought:

  • Domain expertise (what makes sense for financial data)
  • Judgment calls (when to pivot, when to persist)
  • Course corrections (don't kill slow-learning runs too early)
  • Scar tissue (the instinct to add capacity after hitting a plateau)
  • The goal (0.60 AUC means something for trading)

This is what vibe coding looks like for data science.


Why The Tools Mattered

Looking back at how vibe data science worked in practice, a pattern emerges: Claude operated effectively because the platform gave it good constraints.

If you tell an AI "do data science," it flounders. The space of possible actions is too large. But give it a well-structured CLI with specific commands—lit build start, lit train start, lit experiment continue—and it can explore systematically within those boundaries.

This is the "maze vs open field" principle. AI navigates mazes better than open fields. Each command is a bounded operation. The constraints make correct approaches discoverable.

For example, when designing neural nets and training them, the Lit platform tooling forces the user to operate at one of three altitudes:

  1. Components: Reusable neural network building blocks (CNN, LSTM, GRU, Transformer, SlowFast)
  2. Architecture: How components connect—humans get a drag-and-drop design canvas; Claude manipulates the serialized JSON directly
  3. Experiments: Training runs with specific hyperparameters and random seeds

Claude worked at all three levels. Claude wrote novel components (cross-attention, dilated CNN). Claude sketched architectures (the multi-tower ensemble). Claude launched and monitored experiments (169 training runs).

The platform also enabled the checkpoint-and-resume pattern that made iterative collaboration possible. Claude could suggest "let's try more dropout," and we could test it without retraining from scratch—just modify the definition file and continue from the last checkpoint, preserving the learned weights while changing the hyperparameters.

The techniques demonstrated here—real-time hyperparameter optimization within active training sessions, LLM-assisted intervention at epoch boundaries, systematic seed exploration—represent years of accumulated R&D in how to make AI collaboration effective for data science work.

More on this soon.


What's Next

We have one open slot for an H1 2026 data science engagement. If you have:

  • A prediction problem with real data
  • A willingness to work iteratively
  • Interest in seeing what vibe data science can do

Get in touch.

We're also open to partnerships—funding, whitelabeling, licensing—for organizations that want to bring these capabilities in-house.


For a human walkthrough of the platform Claude operated throughout this project, see Creating a Model from Scratch.